
Visual impacts Click here
Wind farms Click here
Power line routing Click here
References Click here
VISUAL IMPACTS
The unforeseen visual impacts of developments have often marred landscapes. The routing of powerlines between a road and an outstanding view, the construction of wind farms on beautiful landscapes and the development of resorts on formerly pristine coastlines are examples.
Robin Boyd, an architect who wrote The Australian Ugliness (1960) anguished at the placement of concrete toilet blocks in front of outstanding views of a coast.
With the availability of digital photography and programs to modify photographs, including the insertion or removal of features, the potential exists to measure accurately the likely visual impact of developments, of changes in land use, and the removal or modification of landscape features. There is no excuse now for not foreseeing accurately the likely visual impact, of measuring the likely community reaction, and of taking action to minimize or avoid it.
Studies of visual impacts by Dr Andrew Lothian
Dr Lothian has carried out five studies involving the assessment of visual impact, two of developments along the coast and River Murray, and three of wind farms. The wind farm surveys are summarised in the section on wind farms.
As part of the Coastal Viewscapes Project (Lothian 2005a), the influence of developments – housing, marinas, and structures such as pens associated with aquaculture – upon scenic quality – was assessed. Existing developments were included in some scenes and photomontages of developments inserted in other scenes. Housing developments covered shacks, which are generally poor-quality structures, located close to the coast, holiday housing which is more conventional housing structures, and high-rise housing developments with apartments. Coastal scenic quality was diminished in all scenes by the presence of development (Figure 1).


Figure 1 Visual impacts of developments on coastal scenic quality
The trend lines of best fit were near parallel, two units apart, indicating that the visual impact of development was independent of the particular level of scenic quality. The presence of development diminished scenic quality by 2 (e.g. 8 reduced to 6 or 7 to 5) regardless of whether the original scenic quality was 8 or 7.
Aquaculture structures had the smallest visual impact while the impact of housing was similar to that of marinas (Table 1). However, the impact of shacks was similar to that of high rise developments. The visual impact of housing sited on headlands and on dunes was similar.
Table 1 Visual impact of developments on coastal scenic quality (1 – 10 scale)

Overall, the impact of coastal development was independent of the level of scenic quality and occurred regardless of whether the area was of high or low scenic quality. Developments generally reduced scenic quality by around two units (on a 1 – 10 scale). Housing and marinas had the largest visual impact while aquaculture structures had less visual impact.
An assessment was undertaken of the influence of development upon scenic quality of the River Murray (Lothian, 2007). The survey covered the location, form and surrounds of houses, houseboats, waterfront treatments, caravan and recreation parks, and irrigation pumps. All scenes were of existing developments photographed along the River. The survey used a nine grade (1 – 9) bi-polar rating scale with 5 being the median. Figure 2 shows the mean grades for the developments.

It is apparent from Figure 2 that most of the developments are on the dislike side, and only a few are liked. Out of the 22 development classes, caravan and recreation parks were graded the highest, well into the “liked” category. Three other classes were neutral: housing setback from the river, natural waterfronts, and sandy beaches. The remaining 18 classes of development were in the “disliked” category. A scene of an eroded river bank was the most disliked scene and irrigation pumps were not much better.
For each form of development, the ratings provided an indication of preferences. In many cases, these preferences coincided with good practice as widely accepted by the environmental and planning professions. However, in some cases they did not.
Other studies of visual impacts of developments
Assessing the visual impact of developments commenced in the mid-1970s as environmental impact assessment methods became more widely used, particularly in the United States following the passage of the National Environment Protection Act 1969 (NEPA). In 1973, the landscape architect, Burton Litton Jnr, proposed Landscape Control Points – a network of permanently established observation sites, which would enable a forester to anticipate visual impacts of management decisions.
An early survey in England asked people about developments that spoilt the countryside and found the caravan sites, particularly on the coast, electricity pylons, the removal of hedgerows, and road construction elicited the most concern (Chapman, 1974).
Early papers at the 1979 National Landscape Conference in the US focused particularly on the visual impacts of developments, including agriculture (Schauman, 1979), dams and water developments (Schueneman, 1979), dredged materials (Mann, 1979), highways (Harvard & Chaplin, 1979), linear pipelines and transmission lines (Ross, 1979), off-road vehicles (McCool, 1979), offshore LNG terminals (Baird, et al, 1979), power plant siting (Bottom & Young, 1979, Petrich, 1979), rangeland management (Brown & Kissel, 1979), ski area development (Lindsay & Mittmann, 1979), surface mining (Leopold et al, 1979), urbanization (Brush, 1979), and visual impact assessment methods (Feimer et al, 1979).
Since then there have been many studies of visual impacts. Table 2 summarizes 23 studies.
Table 2 Summary of visual impact studies (Excluding wind farms)

In Holland, De Vries et al, (2012) investigated the visual impact of eyesores – wind farms, business parks and farm barns, on the Dutch landscape. They examined their visual impact from varying distances, with or without mitigating vegetation, and the heights of the buildings. Ratings increased with distance from the buildings, with the presence of mitigating vegetation, and with lowering the building height (Figure 3). Table 3 compares the rating with the original ratings without these mitigating components and indicates that ratings improved with distance, with screening vegetation, and with lower building heights.

Figure 3 Effect of mitigating components on ratings of business parks
Table 3 Percentage reduction in ratings due to mitigating components for business parks
Using GIS, Mouflis et al, (2008) examined the increasing visual impact of marble quarrying on the island of Thasos in northern Greece. Figure 4 shows the extent of the visual impact in 1984 and 2000. Their visibility increased 2.5 times following the opening of the quarries on the higher mountains.

Summary of Visual Impacts
From the beginning of academic interest in landscape quality in the 1970s, visual impact has been an important subject of research as evidenced by the many papers on visual impacts in the pioneering 1979 National Landscape Conference. Some 22 studies have been identified over the 40-year period, 1974 – 2014. Reinforcing human preference for natural landscapes, a common finding has been that development of any kind in a natural landscape detracts from its beauty. Even in agricultural landscapes there are limits of what people will tolerate.
Some studies have provided guidelines for minimizing the visual impacts of developments. Often the developers do not see the visual impacts they are causing, an example is the second-home owners in Norway (Kaltenborn et al, 2009). There is also a strong preference for the status quo, keeping the landscape, particularly in rural areas, as it is, not appreciating the profound influence that economic and political factors can have on farm viability. The trend in Europe for re-wilding, that is allowing the farms to revert to their original vegetative cover, appears quite widespread. A Dutch study found that the visual impact of farm buildings decreased with distance, with screening vegetation and by lower buildings. The visual impact of mines and quarries, such as on Greek islands, has been severe and appears to proceed without adequate safeguards for the landscape. Some projects in Europe, however, have regenerated former industrial and mining sites with great success.
WIND FARMS

Perhaps no development has raised more concerns regarding their visual impact as wind farms. The construction of their massive scale across the countryside has galvanized criticism and opposition, particularly in the United Kingdom, Europe, United States and Australia. The English experience is particularly interesting given the English love of their countryside:
More than their poets, their art, or their architecture, the English love their landscape and woe betide any who would threaten it. This protectionist attitude has brought wind development in England nearly to a standstill (Short, 2002).
The Economist (1994) described wind farms as a new way to rape the countryside and Sir Bernard Ingham described a wind farm in Yorkshire as lavatory brushes in the air (Pasqualetti, 2001). Ann West, vice Chair of Country Guardian, described them as industrial-size blots on the landscape (West, 2004). Landscape publications in Germany described the destruction of scenic beauty as a catastrophe and the beauty of our landscape is in danger (Hoppe-Kilpper & Steinhäuser, 2002).

Maehr et al, (2015) found that people’s psychophysiological response to wind farms was stronger than churches but similar to powerlines and powerplants. However, they were rated less aversive and more calming compared with powerlines and powerplants and equivalent to churches.
Maarten Wolsink from The Netherlands who has extensively researched wind farms wrote (2007):
“Regarding community acceptance of wind power schemes, the visual evaluation of the impact of wind power on the values of the landscape is by far the most dominant factor in explaining opposition or support. Type of landscape fully overshadows other attitudinal attributes, as well as other visual and scenic factors such as the design of wind turbines and wind farms, and the number and size of turbines.”
Mimicking President Clinton’s motto, It’s the economy, stupid!, Wolsink coined: It’s the landscape, stupid!
Figure 5 shows the dense distribution of wind farms in the United Kingdom and across Europe. In 2000, there were only 30 sites in England Wales, by 2011 this had grown five-fold to 150. The dense concentration of wind farms in Germany is particularly apparent. The density of wind farms and the rapidity of the change in the landscape by such a significant visual element is a major reason for the antagonism they generate.


Figure 5 Distribution of wind farms in the United Kingdom (2012) and Europe (2017)
An additional factor in their visual impact is the growth in their size. During the 1980s, wind turbines were less than 50 m in height to the top of the hub with 10 – 15 m blades. By 2015, turbines had grown to 125 m with 50 m blades. These are very sizeable structures in the landscape, far larger than electricity transmission towers (Figure 6). Old 60 m turbines are being replaced by 150 m high turbines in a process called repowering which has also drawn flack.

Figure 6 Height comparison of 60 m and 125 m wind turbines
While in England, turbines are not permitted within 2 miles (3 km) of housing, in Bavaria it is only 0.3 mile (0.5 km) and in Saxony only 0.2 mile (300 m).
Germany has a goal of 30% electricity from renewables by 2020 and 50% by 2050. In 2015, there were 26,772 turbines generating 44,947 MW or 13.3% German electricity. Even tourist areas have been targeted for wind farms including the Moselle valley, the Allgäu, Lake Constance and the foothills of the Alps. The German Association for Landscape Protection generally opposed wind farms. Over 700 citizens’ initiatives have been founded in Germany to campaign against what they describe as forests of masts, visual emissions, and the widespread devastation of our highland summits (Schulz, 2013). Meyerhoff et al (2010) used choice modeling to assess the social acceptability of various wind farm options with local communities in Germany.
Offshore wind farms have expanded greatly, driven in part by the opposition to onshore wind farms. Currently, they are mainly located in the seas off Europe – North Sea, Baltic Sea, Irish Sea and the English Channel, but offshore developments have also commenced off China, Japan, South Korea, Taiwan and the US. In Europe, the strategy is to site the turbines out to sea, out of sight and out of mind (Babbage 2010). Brownlee et al, (2015) have researched marine recreationists attitude to wind farms. Figure 7 shows the rapid growth of wind farms globally since 2000.

BP Statistical review of global energy Figure 7 Global wind energy, 1995 – 2020
The greatest growth in wind farms is in China with nearly half the new global installations occurring (2015) but where little protest has been reported. Since 2006, China’s Renewable Energy Law has required power grid operators to purchase a full amount of wind power generated by registered producers (Saidur et al, 2010).
In Europe, the European Parliament and European Council Renewable Energy Source Directive 2001/77/EC was issued in 2001 on the promotion of electricity produced by renewable energy sources in the internal electricity market. This set indicative targets for member nations for 2010. On 5 June, 2009, this Directive was replaced with the Renewables Directive 2009/28/EC which mandated targets for 2020 including Germany 18%, France 23%, UK 15%, Italy 17% and Denmark 30%. An overall EU target of 20% was set in 2007. Germany, however, has increased its target to 40-45% by 2025, driven by the Renewable Energy Sources Act (Erneuerbare Energien Gesetz – EEG), increasing to 80% by 2050. In 2014, 28.5% of electricity in Germany was from renewable sources.
There have been many studies of the visual impact of wind farms. Molnarova et al, (2012) summarized 18 such studies. In 2005, Devine-Wright developed a matrix of factors affecting the public’s perception of wind farms to which Graham et al, (2009) added further aspects. Table 4 shows the consolidated list.
Table 4 Factors affecting public perceptions of wind farms and renewable energy

In a review of three wind farm proposals in New Zealand, Graham et al, (2009) found that their potential visual impact on the landscape was the foremost concern, a finding replicated in many proposals around the world. They concluded from their study that wind farm proposals would be less likely to generate local opposition if they have the following characteristics:
- the public was collaboratively involved in the process from an early stage;
- the site was not within or close to a valued landscape or valued features;
- local impacts of construction were minimized;
- the developer was perceived to be a good citizen;
- impacts on the natural environment were minimized;
- the wind farm was not too large and was not close to other wind farms; and
- the wind farm was not seriously at odds with conceptions of place and identity.
In 2011, Ian Bishop of the University of Melbourne presented to the World Renewable Energy Congress in Sweden an analysis of 31 studies of the public response to wind farms across the world. He found:
“a large gap between the knowledge required for effective planning and the agreed understanding of visual and other impact levels, and the influence of planning and communication processes. There is only limited agreement on some basic impact variables: numbers of turbines, amelioration with distance, role of design and so forth. There is no consensus on what methods should be used to assess acceptability or to design for acceptable outcomes. This means that, in many countries, there is no societal consensus about the acceptability of wide-spread deployment of wind energy systems.”
He found the following relating to the aesthetic aspects of wind farms (Table 5).
Table 5 Key findings of aesthetic response to wind farms (results of various studies)
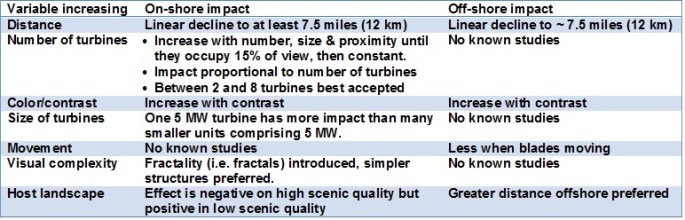
There are considerable uncertainties regarding the planning of wind farms but Bishop concluded the following:
- Aesthetic impacts are less the further the viewer is from the turbines (although we have no clear idea of the shape of the distance-impact curve);
- Contrast with the surroundings and background should be low;
- Wind farms should not be located in highly valued landscapes;
- The distribution and design of the turbines should have regard for aesthetic factors such as complexity and continuity;
- Protected sites should be avoided;
- Less dissent arises through involvement of the local population in the siting procedure, transparent planning processes, and a high information level;
- Familiarity with existing small-scale projects is likely to increase later acceptance of further projects.
Ian Bishop has developed computer simulation software to enable the visual impact of proposed wind farms to be evaluated (Bishop 2002, 2007, 2010). A number of authors have applied GIS and multi-criteria tools to the wind farm site selection and visual impact assessment including: Simao et al, 2009; Torres Sibille et al, 2009; Molina-Ruiz et al, 2011, and van Haaren & Fthenakis, 2011.

As part of their investigation of the visual impact of developments on the Dutch landscape, De Vries et al, (2012) included wind farms. The examined the mitigating influence of distance to the turbines, their height and their configuration (Table 6). Turbines at 500 m distance reduced ratings from 5.91 to 3.77 (7-point scale), a reduction of 36%. When the turbines were viewed at 2000 m distance, this fell to 25% reduction (to 4.42). Thus distance had a slight influence (Figure 8). Increasing the height of turbines increased their visual impact, but whether the turbines were in a cluster or in linear configuration did not make much difference.
Table 6 Percentage reduction in ratings due to mitigating components for wind farms


De Vries et al, 2012. Figure 8 Distance-impact curve of wind farms in Dutch landscape
As a surrogate of visual impact, several authors have examined the impact of wind farms on property values as this is often a concern regarding proposed wind farms. In England, Gibbons (2014) found wind farms reduce house prices in postcodes where the turbines are visible, and reduce prices relative to postcodes close to wind farms where the wind farms are not visible. Averaging over wind farms of all sizes, this price reduction is around 5-6% within 1.2 miles (2 km), falling to less than 2% between 1.2 and 2.5 miles (2 and 4 km), and less than 1% by 8.7 miles (14km), which is at the limit of likely visibility. Small wind farms have no impact beyond 2.5 miles (4 km), whereas the largest wind farms (20+ turbines) reduce prices by 12% within 1.2 miles (2 km), and reduce prices by small amounts (~1.5%) right out to 8.7 miles (14km).
In contrast, in the US, Hoen et al, (2010) found that neither the view of the wind facilities nor the distance of the home to those facilities had a statistically significant effect on home sales prices. However, they did not assess price changes within 1000 feet (304 m) of the wind farm. Lilley et al (2010) assessed the impact of offshore wind farms on tourist use of Delaware beaches and found around 25% of visitors would switch beaches if an offshore wind project was located 6.2 miles (10 km) from the coast, but this dropped with greater distance from shore.
A German study (Sunak & Madlener, 2012) found some evidence for negative local pricing effects of proximity to the site and shadowing caused by wind turbines, but the results were not sufficiently determinant.
In the UK, Jones & Eiser (2010) found that people were happy about offshore wind farms but not keen on onshore sites. However, as long as the proposal was “out of sight” they were happy, a typical “not in my backyard” (NIMBY) response.

A study in Greece (Kaldellis, 2005) found that while there was strong support for wind farms on the islands, the opposite applied on the mainland: islands, 80 – 90% supported existing wind farms, mainland 15 – 40% support. The study pointed to a minority of around 15% who were strongly opposed to new wind farms regardless of their benefits. Tsoutsos et al (2009) examined the visual impact of a proposed wind farm on Crete.
A study by the Argonne National Laboratory in the US of five wind farms, hub heights 230 – 260 feet (70 – 80 m), found (Sullivan et al, 2012): The facilities were found to be visible to the unaided eye at >58 km (36 miles) under optimal viewing conditions, with turbine blade movement often visible at 39 km (24 miles). Under favorable viewing conditions, the wind facilities were judged to be major foci of visual attention at up to 19 km (12 miles) and likely to be noticed by casual observers at >37 km (23 miles). A conservative interpretation suggests that for such facilities, an appropriate radius for visual impact analysis would be 48 km (30 miles), that the facilities would be unlikely to be missed by casual observers at up to 32 km (20 miles), and that the facilities could be major sources of visual contrast at up to 16 km (10 miles).
A Norwegian study has examined the impact of wind farms on cultural heritage (Jerpåsen & Larsen, 2011).
In Australia, the State of Victoria witnessed the strongest opposition to new wind farms. In 1997, 95 wind turbines were proposed on the coast near Portland, an area identified by the Victorian Coastal Council as of outstanding scenic quality requiring special landscape protection (VCC, 1998). On appeal, the proposal was rejected on grounds that the wind farm would have a disturbing visual impact on the significant landscape values of the Cape (VCAT, 1999). Subsequently, the proponent proposed a four cluster, 120 turbine wind farm. The Planning Panel appointed to report on the project recommended qualified approval of the proposal with amendments (PPV, 2002), and the Planning Minister approved it with modifications.
Hindmarsh (2010) analysed the extent of community engagement in wind farm planning in Australia and, not surprisingly, found it inadequate. He suggested:
“A more promising approach is the collaborative approach, which can also facilitate social mapping of local community qualifications and boundaries about wind farm location alongside technical mapping of wind resources. This is needed to identify the most socially, economically and technically viable locations to locate wind farms to ensure effective renewable energy transitions.”
In 2003, the author carried out a study of the likely visual impact from wind farms in South Australia (Lothian, 2008). Scenes were selected to represent both proposed and potential wind farm sites on the coast (21 scenes) and on inland agricultural land (47 sites). The sites were photographed, and the images scanned and standardized digitally to show blue skies so that the presence of clouds would not influence ratings. Photomontages were prepared, inserting standard wind turbines into the original photographs. The scenes were arranged in random order. Because viewing wind farms may have been novel for participants, the first ten scenes were replicated at the end of the 150 scenes and the first ten ratings discarded. Participants viewed the survey and rated the images on a 1 – 10 scale in viewing sessions, from a CD or an Internet survey. The ratings of 311 participants who completed 150 or more scenes were selected for analysis.

The results were analyzed separately for the coastal and inland scenes. Figure 9 shows the differences for coastal scenes in descending order of rating without the wind farm. This indicates the rating of each scene with and without the wind farm. With few exceptions, the difference was largest where the scenic quality was high and narrowed as the rating decreased. In all coastal locations, however, the presence of the wind farm diminished scenic quality.

In agricultural landscapes, the presence of wind farms affected areas of high scenic quality but in areas of lower scenic quality the presence of the wind farm actually enhanced scenic quality (Figure 10). This implied that in landscapes of low quality, below 5.1 rating, the presence of the wind farm added interest to an otherwise mediocre landscape and thus enhanced its perceived scenic quality.


From trend lines derived from the data, Table 7 indicates the expected impact of a wind farm on coastal and agricultural landscapes. For example, the rating of a coastal landscape which rated 8 without a wind farm could be expected to decrease to a rating of 6.2 with the presence of a wind farm.
Table 7 Effect of wind farms on scenic quality rating (1 – 10 scale)

In Australia, in an attempt to address the visual impacts of wind farms, the industry group, Austwind, partnered with the Australian Council of National Trusts in preparing a framework for landscape values assessment – Wind Farms and Landscape Values: A National Assessment Framework (Austwind, 2007). The framework provided a comprehensive process for assessing, evaluating and managing the visual impacts of wind farms but left it up to the developers to decide the actual technical methods, tools and techniques they would use.
Recognizing that renewable energy technologies reduce our reliance on fossil fuels with their substantial adverse environmental and health effects, Bisbee (2004) argued in the US in the context of National Environment Protection Act (NEPA) that these benefits are more important than their visual impact: local aesthetic preferences must not be permitted to overshadow broad regional benefits. She concluded the essentially legal review:
“Offshore wind power can reduce emissions of air pollutants that are contributing to global warming and causing premature deaths. This is the most important impact of offshore wind, and it deserves immediate, in-depth attention. Used appropriately, NEPA can show decision makers that when they choose to save the view, they also choose to perpetuate the adverse effects of fossil-fuel use on human health and the environment.”
This is the prevailing paradox of visual impacts of wind farms, that their benefits accrue to the wider community but the local community bears their dis-benefits.
Threshold of acceptability
The crucial issue for wind farm location is their acceptability to the community. What is the threshold level when a wind farm shifts from being acceptable to unacceptable? In a hand book on visual impacts, Buchan (2002) noted:
“Ultimately, significant is whatever individuals, people, organizations, institutions, society and/or policy say is significant – it is a human evaluative and subjective judgement on which there may or may not be consensus. It is therefore important that two separate but critical characteristics of all effects – magnitude and significance – are clearly distinguished.”
Buchan proposed the use of matrices to determine significance, these were however, indicative suggestions only and a case by-case approach is required in assessing significance for individual windfarm proposals…
Palmer (2015) reviewed statistical methods of determining significance of the scenic impact and referred to a study by Arthur Stamps (1997) who reviewed thousands of ratings for paired landscape scenes and adopted Cohen’s (1988) effect size thresholds. Cohen used the standardized mean difference – i.e. the difference between two population means that is divided by the population standard deviation (SD). Stamps proposed:
Difference = 0.2 is trivial or too small to be noticed.
Difference = 0.5 is a medium size effect, large enough to be visible to the naked eye.
Difference = 0.8 is grossly perceptible, sufficient to draw one’s gaze.
Stamps further suggested a threshold of difference = 1.1 of a very large impact that authorities should anticipate public opposition. However, Palmer suggested:
0 – 0.2 Possibly go unnoticed
0.2 – 0.5 Noticeable but not adverse
0.5 – 1.1 Adverse
> 1.1 Unreasonably adverse
In applying such criteria, the level of landscape quality prior to the development needs to be considered. The visual impact of a development in a landscape of 4 or 5 rating will be far less objectionable than a development in a landscape of 6, 7 or especially 8 rating as we saw in the South Australian inland example above. The thresholds in landscapes of high quality will be considerable less than the thresholds for landscapes of low quality. A reduction from 8 to 7 will be far more objectionable than a reduction from 5 to 4. Thus two factors need to be considered in establishing visual thresholds, firstly the rating of the subject landscape, and secondly, the reduction in landscape quality that results from the development.
Survey of the visual impact and acceptability of wind farms
In 2018, Andrew Lothian carried out a survey in Australia to ascertain the acceptability of the visual impact of wind farms. Existing wind farms in South Australia, Victoria and New South Wales were photographed and an Internet survey used. There were 49 scenes with wind farms and 49 without them, a total of 98 scenes. The survey included ten scenes from the 2003 survey to cover potential coastal sites. The survey was posted online in March, 2018 and remained available for 31 days by which time 850 people had participated. Invitations to participate were forwarded to local government councils in three states and to clubs across Australia. The data set used for analysis comprised 779 respondents. They were asked to rate the scenic quality of the scene on a 1 (low) – 10 (high) scale and, for those scenes containing wind farms, to indicate their acceptability on a 5-point scale from Very Acceptable to Very Unacceptable.

Wind farm factors which affected ratings were:
- Ratings decreased slightly with more turbines; increasing the turbines from 20 to 50 reduced ratings by 0.63;
- Placing turbines linearally along ridges rated 0.40 higher than random layouts;
- The height of turbines had virtually no influence on ratings: increasing the height from 100 m to 150 m reduced ratings by 0.18;
- Increasing the generating capacity of the turbines (MW) ha scarcely no influence; increasing capacity from 2MW to 3 MW reduced ratings by 0.054.
Key factors for developers to take into account are the number of turbines and their distribution layout with linear along ridges preferred over random layouts.
The acceptable scores were three times as prevalent as the unacceptable. In only one scene were the unacceptable scores higher than the acceptable (Table 8). The community found wind farms acceptable in virtually all landscapes, including all but one coastal scene. This was despite the respondent’s own ratings of scenic quality showing that scenes with wind farms rated lower than scenes without them. In other words, despite their acknowledgement that wind farms diminished scenic quality, they still found them acceptable.
Table 8 Number of participants rating acceptability of wind farms

Comparing the results with the Standardized Mean Difference criteria indicated that 9 scenes would be classified as unreasonably adverse and a further 11 were adverse (Table 9).
Table 9 Application of Standardized Mean Difference to results
 These findings suggest that the community is quite tolerant of the visual impact of wind farms.
In 2019, the author conducted a survey of the acceptability of wind farms in Britain among councils, covering England, Scotland and part of Wales. The survey comprised 46 scenes, half with the wind farms and half without. The Internet survey was sent to councillors and senior staff in local and county authorities and 783 responses were analysed.
While respondents from England were fairly relaxed about wind farms, with 63% finding them acceptable compared with 49% from Wales and 34% in Scotland, (Table 10). This suggests that the threshold of acceptability has been passed in Scotland and is approaching it for Wales.
Table 10 Acceptability of wind farms by country (%)

While both local and county councillors generally found wind farms acceptable, the opposite applied to senior staff, many of whom rated the wind farms as very unacceptable (Table 11). This suggests a source of tension between the councillors and staff.
Table 11 Acceptability of wind farms to Council staff and Councillors (%)

Attitudes toward wind farms also shaped their acceptability by respondents, with those in favour finding most wind farms acceptable while those against them finding virtually all wind farms unacceptable.
A strategic approach to wind farm location
The key issue regarding wind farms is their location; once that is determined, any ameliorative measures have minimal effect on their visual impact. Therefore, choosing their location is the vital first step. The current approach is determined solely by the industry who submits proposals with the planning agency that reacts to these but is unable to guide their location. Inevitably, the companies choose sites which maximize their return so whether it is a highly scenic site is irrelevant. In Australia that has resulted in many proposals near the coast. A better, more strategic approach is needed.

Cathedral Rocks wind farm, southern Eyre Peninsula. Built on South Australia’s highest scenic quality coast
From the analysis carried out in South Australia (Lothian, 2008) the likely visual impact of wind farms in coastal and inland areas was determined. While this could be further researched with a wider range of numbers of turbines, configurations and locations, the basic findings are likely to remain valid, i.e. that wind farms within sight of the sea are likely to diminish scenic quality and that wind farms in inland areas of low scenic quality can actually enhance landscape quality. It would be logical, therefore, to combine maps of scenic quality, wind resources, electricity infrastructure, towns and settlements and other environmental and social factors such as national parks and heritage areas.
Rather than reacting to industry proposals, this strategic approach would be conducted by the relevant planning authority and its findings given legal standing so as to guide industry to favored locations. By this means, the social, economic and environmental benefits of renewable energy would be gained but without the significant social angst that accompanies them at present. Watson & Hudson (2015) applied GIS to a 6,500 sq mile (17,000 sq km) area of south west England to determine suitable locations for wind farms and solar farms.
Figure 11 illustrates this approach using South Australia as an example. The wind atlas provides data on the strength of the wind at 80 m above ground based on surveys conducted between 1995 and 2005. The map of landscape quality is derived from Lothian (2000) and covers the State. Subsequent studies have highlighted the high landscape value of many parts of the coast, particularly on Eyre Peninsula, Kangaroo Island and the South East. The electricity transmission grid map shows where the electricity from wind farms needs to be connected; the long distances to the grid on western Eyre Peninsula, for example, make it an unviable location in which to place wind farms. The map of population density is a surrogate of the social constraint that applies to wind farms. Finally, the map of existing wind farms also identifies locations that may be suitable for wind farms.

All five favored wind farm locations would be sited well inland from the coast, say 3 miles (5 km). The site on southern Eyre Peninsula gains from the strong winds and the proximity to the electricity grid. The site near Burra further extends the existing wind farms and utilizes the low north-south ranges on which the turbines are located. The site near Murray Bridge would be located immediately north of Lakes Alexandrina and Albert, a sparsely populated area which is close to the demand centers for electricity. The site inland from the Coorong is also sparsely populated and would utilize the strong winds there and its proximity to the interstate grid. Kangaroo Island is poorly served by electricity from the mainland and would be suitable for a wind farm near the center of the island, away from the highly scenic coast.
This example illustrates a simple strategic approach that should be followed to indicate favored locations for wind farms that consider environmental, technical and social factors. The analysis undertaken would necessarily be far more detailed and rigorous than that illustrated but the strategic approach remains the same, Governments should determine which areas are acceptable and which are not acceptable. Following the selection of the region in which wind farms would be deemed acceptable, further detailed work would be required to analyze the local characteristics and work with the local communities to determine where they could be sited with minimal impact.
Summary of wind farms
While wind farms can significantly reduce a country’s greenhouse gas emissions and the health effects of burning fossil fuels, their placement in the countryside needs to be handled sensitively. The difficulties in gaining consent in the UK are now such that all new wind farms are located offshore. Objective studies of their visual impact indicate that when they are located near the sea they invariably lower scenic quality, but away from water, in rural areas which have low scenic quality, their presence can actually enhance scenic quality through the added interest they provide. The key issue in wind farms is location; that they are worthwhile investments is indisputable, but the community need to ensure that their benefits are gained without sacrificing the very qualities of the landscape that they value.
The threshold of what may be regarded as acceptable may be based on an analysis of ratings of sites with and without wind farms and the application of Cohen’s standardized mean difference. Applying the standardized mean difference to the results of a survey of wind farms in Australia found a large number were regarded as adverse or unreasonably adverse, but despite this, all but one of the 49 wind farms were regarded by respondents as acceptable, even in high quality landscapes. This suggests the community is very tolerant of the visual impact of wind farms.
Wind farm companies typically seek the windiest sites close to the electricity grid, and governments have been reluctant to provide guidance. By integrating considerations of landscape and other environmental and social concerns with the distribution of the wind and infrastructure distribution, a strategic approach can be taken in which the government can indicate preferred areas and also identify no-go areas.
Power line routing
Prior to wind farms, the routing of major electricity transmission lines provided an opportunity to simulate their appearance and assess their visual impact. The author’s Lake District study (Lothian 2013) compared four scenes with and without powerlines and showed that they can have a very significant impact on landscape quality, reducing ratings by an average of 1.47 or 45% (Figure 12). The reduction in ratings ranged from 34% to 62%.

An early study in 1975 – 78 by Murray et al (1979) evaluated four powerline routes in the Idaho/Montana area, including potential visual impacts as one factor in the assessment, and the least impact corridor was selected. Hadrian et al, (1988) applied various factors including visual impact to the selection of routes for a powerline in Melbourne and developed an automated mapping instrument which quantified the various impacts (Figure 13).

More sophisticated methods were developed to evaluate alternative routes. In Rimini, Italy, Bagli et al, (2011) applied least-cost path analysis (LCPA) to find the “cheapest” way to connect two locations based on cost and considerations of the impacts on health (electro-magnetic pollution), landscape (e.g. visibility from housing) and nature (e.g. bird collision risk). Table 12 shows that, based on the evaluation of the criteria for the four options, they are similar. By applying an interval standardization measure, bringing them to a 1 – 10 scale, the differences were accentuated.
Table 12 Evaluation matrix of four powerline routes

Ian Bishop (1985) simulated the appearance of electricity transmission towers and found that the appearance of the towers generated 90% of the community’s adverse reaction, and that only 10% related to the design of the tower, implying that it is the location rather than the design which is of significance. Making the towers taller, and thereby requiring fewer towers, might also be implied. Towers that use a single pole rather than the two-legged lattice tower were preferred. In a subsequent study (Bishop et al, 1990) in which people were asked to rate various towers, they found, counterintuitively, that tall towers were preferred to shorter towers but shorter poles were preferred to taller poles (Table 13). They attributed this to the familiarity of the preferred options. They also found that guyed lattice structures, which were not used locally, were not preferred.
Table 13 Rating of different electricity towers and heights

Many studies have costed the landscape and other benefits of undergrounding powerlines. Tempesta et al, (2014) examined the landscape benefits of undergrounding high-voltage powerlines and their paper provides a comprehensive list of references of other studies.
These few studies of powerline routing illustrate the power of providing visualizations of the proposals and of evaluating alternative routes to select the optimum route.
REFERENCES
Boyd, R., 1960. The Australian Ugliness. Penguin Books
Auswind, 2007. Wind farms and Landscape Values: A National Assessment Framework. Australian Council of National Trusts.
Bagli, S. & D. Geneletti & F. Orsi, 2011. Routing of power lines through least-cost path analysis and multicriteria evaluation to minimize environmental impacts. EIA Review, 31:3,
Baird, B.E., S.R.J. Sheppard & R.C. Smardon, 1979. Visual simulation of offshore liquefied natural gas (LNG) terminals in a decision-making context. In: Elsner & Smardon (Eds), 1979.
Bisbee, D.W., 2004. NEPA review of offshore wind farms: Ensuring emission reduction benefits outweigh visual impacts. Boston College Env. Affairs Review, 31:2, 349 – 384.
Bishop, I.D., 2011. What do we really know? A meta-analysis of studies into public responses to wind energy. World Renewable Energy Congress, 8-13 May, Sweden.
Bishop, I.D., P. Dartnell, S. Davie, J. Drew, T. McDonald & P. Swan, 1990. Object, environment and observer related variables in the visual effect of electricity transmission structures. Landscape Australia, 1, 23 -30.
Bishop, I.D., R.B. Hull & P.N.A. Leahy, 1985. Visual simulation and assessment of electricity transmission towers. Landscape Australia, 3, 191 – 199.
Bottom, B. & A. Young, 1979. A simulated field trip: The visual aspects of power plant siting. In: Elsner & Smardon (Eds), 1979.
Brownlee, M.T.J., J.C. Hallo, L.W. Jodice, D.D. Moore, R.B. Powell & B.A. Wright, 2015. Place attachment and marine recreationists’ attitudes towards offshore wind energy development. Jnl. Leisure Res., 47:2, 263 – 284.
Buchan, N., 2002. Visual Assessment of Windfarms Best Practice. Scottish Natural Heritage Commissioned Report F01AA303A, University of Newcastle.
Chapman, V., 1974. Reactions to developments in the countryside in terms of landscape change. Landscape Research, 1:7, 4 – 7.
Clamp, P., 1975. A study in the evaluation of landscape and the impact of roads. Landscape Research, 1:11, 6 – 7.
Cloquell-Ballester, V.A., A. del Carmen Torres-Sibille, V.A. Cloquell-Ballester & M.C. Santamarina-Siurana, 2012. Human alteration of the rural landscape: variations in visual perception. EIA Review, 32:1, 50 – 60.
Coeterier, J.F., 1994. Non-agricultural use of the countryside in the Netherlands: what is local opinion? Landscape & Urban Plg., 29:1, 55 – 69.
Cohen, J., 1988. Statistical Power Analysis for the Behavioral Sciences. 2nd Ed, New York, Psychology Press.
De Vries, S., M. deGroot & J. Boers, 2012 Eyesores in sight: quantifying the impact of man-made elements on the scenic beauty of Dutch landscape. Landscape & Urban Plg., 105:1-2, 118 – 127.
Devine-Wright, P., 2005. Beyond NIMBYism: towards an integrated framework for understanding public perceptions of wind energy. Wind Energy, 8, 125–139.
Elsner, G.H. & R.C. Smardon (Eds), 1979. Proceedings of Our National Landscape Conference on Applied Techniques for Analysis and Management of the Visual Resource, 23-25 April, 1979, Incline Village, Nevada.
Feimer, N. R., K.H. Craik, R.C. Smardon & S.R.J. Sheppard, 1979. Appraising the reliability of visual impact assessment methods. In: Elsner & Smardon (Eds), 1979.
Feimer, N.R., R.C. Smardon & K.H. Craik, 1981. Evaluating the effectiveness of observer based visual resource and impact assessment methods. Landscape Research, 6:1, 12 – 16.
Gibbons, S., 2014. Gone with the Wind: Valuing The Visual Impacts of Wind Turbines Through House Prices. SERC Discussion Paper 159, Spatial Economics Research Centre London School of Economics.
Gobster, P.H., 1983. Judged appropriateness of residential structures in natural and developed shoreland settings. EDRA Conference 14.
Graham, J.B, J. R. Stephenson & I. J. Smith, 2009. Public perceptions of wind energy developments: case studies from NZ. Energy Policy. 37:9, 3348-3357.
Grêt-Regamey, A., I.D. Bishop & P. Bebi, 2007. Predicting the scenic beauty value of mapped landscape changes in a mountainous region through the use of GIS. Env. & Plg B, 34:1, 50 – 67.
Hadrian, D.R., I.D. Bishop & R. Mitcheltree, 1988. Automated mapping of visual impacts in utility corridors. Landscape & Urban Plg., 16:3, 261 – 282.
Harvard, P.M. & B.L. Chaplin, 1979. Highway development. In: Elsner & Smardon (Eds), 1979.
Hernandez, J., L. Garcia & F. Ayuga, 2004. Assessment of the visual impact made on the landscape by new buildings: a methodology for site selection. Landscape & Urban Plg., 68:1, 15 – 28.
Hindmarsh, R., 2010. Wind farms and community engagement in Australia: A critical analysis for policy learning. East Asian Science, Technology and Society, 4, 541–563.
Hoen, B., R. Wiser, P. Cappers, M. Thayer & G. Sethi, 2010. Wind energy facilities and residential properties: The effect of proximity and view on sales prices. American Real Estate Society Annual Conference, Naples, Florida, 14-17 April 2010.
Hoppe-Kilpper, M. & Steinhäuser, U., 2002. Wind landscapes in the German milieu. In: Pasqualetti et al, 2002.
Jerpåsen, G.B. & K.C. Larsen, 2011. Visual impact of wind farms on cultural heritage: A Norwegian study. Env. Impact Ass. Review, 31, 206 – 215.
Jones, C.R. & J.R. Eiser, 2010. Understanding ‘local’ opposition to wind development in the UK: How big is a backyard? Energy Policy, 38:6, 3106–3117.
Kaldellis, J.K., 2005. Social attitude towards wind energy applications in Greece. Energy Policy, 33, 595 – 602.
Kaltenborn, B.P., O. Andersen & C. Nellermann, 2009. Amenity development in the Norwegian mountains: Effects of second home owner environmental attitudes on preferences for alternative development options. Landscape & Urban Plg., 91:4, 196 – 201.
Leopold, R., B. Rowland & R. Stalder, 1979. Surface Mining. In: Elsner & Smardon (Eds), 1979.
Lilley, M.B., J. Firestone, W. Kempton, 2010. The effect of wind power installations on coastal tourism. Energies, 3, 1 – 22.
Lindemann-Matthies, P., R. Briegel, B. Schüpbach & X. Junge, 2010. Aesthetic preference for a Swiss alpine landscape: the impact of different agricultural land-use with different biodiversity. Landscape & Urban Plg., 98, 99 – 109.
Lindsay J.J. & H.J. Mittmann, 1979. Ski area development. In: Elsner & Smardon (Eds), 1979.
Litton, R.B. Jr., 1973. Landscape control points: a procedure for predicting and monitoring visual impacts. Research. Paper PSW-RP-91. Pacific Southwest Forest and Range Experiment Station, Forest Service, U.S.D.A.
Lothian, A., 2008. Scenic perceptions of the visual effects of wind farms on South Australian landscapes. Geographical Research, 46:2, 196 – 207.
Lothian, A., 2008. Visual impact assessment of some developments in South Australia. 2008. Australian Planner, 45:4, 35 – 41.
Lothian, A., 2018. A community survey of the visual impact and acceptability of wind farms in Australia. Scenic Solutions, Adelaide, Australia. 109 pp.
Lothian, A., 2020. A survey of the visual impact and community acceptance of wind farms in Australia, Australian Planner. 6:3, 217-227, October.
Lothian, A., 2021. Visual impacts and acceptability of wind farms to councillors and senior council staff in Britain, International Journal of Environmental Studies, (on-line).
Lothian, A., 2020. Survey of the visual impacts and acceptability to councillors of wind farms in Britain. Scenic Solutions, Adelaide, Australia. 104 pp.
Maehr, A.M., G.R. Watts, J. Hanratty & D. Talmi, 2015. Emotional responses to images of wind turbines: a psychophysiological study of their visual impact on the landscape. Landscape & Urban Plg., 142, 71 – 79.
Mann, R., 1979. A Technique for the assessment of the visual impact of nearshore confined dredged materials and other built islands. In: Elsner & Smardon (Eds), 1979.
McCool, S.F., 1979. The off-road recreation vehicle—visual impacts. In: Elsner & Smardon (Eds), 1979.
Menárguez, A.B.B. & P.M. Holgado, 2014. Assessing the landscape value of public works: validation of the methods in the lowlands of the middle section of the Tajo River, Spain. Landscape Research, 39:3, 305 – 323.
Meyerhoff, J., C. Ohl & V. Hartje, V., 2010. Landscape externalities from onshore wind power. Energy Policy, 38:1, 82-92.
Millward, H., 1985. Assessing the visual impact of deep coal-mining. Geoforum, 16:3, 307 – 317.
Molina-Ruiz, J., M.J. Martinez-Sanchez, C. Pirez-Sirvent, M.L. Tudela-Serrano, M.L. Garcia Lorenzo, 2011, Developing and applying a GIS-assisted approach to evaluate visual impact in wind farms. Renewable Energy, 36, 1125 – 1132.
Mouflis, G.D., I.Z. Gitas, S. Iliadou & G. Mitri, 2008. Assessment of the visual impact of marble quarry expansion (1984 – 2000) on the landscape of Thasos island, NE Greece. Landscape & Urban Plg., 86:1, 92 – 102.
Murray, T.J, D.J. Bisenius & J.G. Marcotte, 1979. Northwest Montana/North Idaho transmission corridor study: A computer-assisted corridor location and impact evaluation assessment. In: Elsner & Smardon (Eds), 1979.
Nassauer, J.I. & M.K. Benner, 1984. Visual preferences for a coastal landscape including oil and gas development. Jnl. Env. Mgt., 18, 323 – 338.
Nassauer, J.I., 1983. Oil and gas development in a coastal landscape: Visual preferences and management implications. Coastal Zone Mgt. Jnl., 11:3, 199 – 217.
Palmer, J.F., 2015. Effect size as a basis for evaluating the acceptability of scenic impacts: Ten wind energy projects from Maine, USA. Landscape & Urban Plg., 140, 56 – 66.
Park, J.J. & P. Selman, 2011. Attitudes toward rural landscape change in England. Env. & Behav., 43:2, 182 – 206.
Pasqualetti, M.J., 2001: Wind energy landscapes: society and technology in the California desert. Society and Natural Resources 14, 689 – 699.
Pasqualetti, M.J., P. Gipe & R.W. Righter, 2002. Wind Power in View: Energy Landscapes in a Crowded World. Academic Press.
Petrich, C.H., 1979. Aesthetic Impact of a proposed power plant on an historic wilderness landscape. In: Elsner & Smardon (Eds).
Planning Panels Victoria (PPV), 2002: Portland Wind Energy Project. 5 volumes.
Ross, R.W., 1979. Linear utility corridors – a simulated visual field trip. In: Elsner & Smardon (Eds), 1979.
Ruelle, C., J-M. Halleux & J. Teller, 2013. Landscape quality and brownfield regeneration: A community investigation approach inspired by landscape preference studies. Landscape Research, 38:1, 75 – 99.
Saidur, R., M.R. Islam, N.A. Ramin & K.H. Solangi, 2010. A review of global wind energy policy. Renewable & Sustainable Energy Reviews, 14, 1744 – 1762.
Schauman, S., 1979. The countryside visual resource. In: Elsner & Smardon (Eds), 1979.
Schomaker, J.H., 1978. Measurement of preferences for proposed landscape modifications. Landscape Research, 3, 5- 9.
Schroeder, H.W., 1988. Visual impact of hillside development: comparison of measurements derived from aerial and ground-level photographs. Landscape & Urban Plg., 15:1-2, 119 – 126.
Schueneman, R.H., 1979. Dams and water developments. In: Elsner & Smardon (Eds), 1979.
Simao, A., P.J. Desham, M. Haklay, 2009. Web-based GIS for collaborative planning and public participation: An application to the strategic planning of wind farm sites. Jnl Env. Mgt, 90, 2027 – 40.
Smardon, R.C., 1988. Visual impact assessment for island and coastal environments. Impact Ass., 6:1, 5 – 24.
Stamps, A.E., 1997. A paradigm for distinguishing significant from non-significant visual impacts: theory, implementation, case histories. EIA Review, 17:4, 249 – 293.
Sullivan, R.G., L.B. Kirchler, T. Lahti, S. Roché, K. Beckman, B. Cantwell & P. Richmond, 2012. Wind turbine visibility and visual impact threshold distances in western landscapes. Argonne National Laboratory.
Sunak, Y. & R. Madlener, 2012. The Impact of Wind Farms on Property Values: A Geographically Weighted Hedonic Pricing Model. FCN Working Paper No. 3/2012, Institute for Future Energy Consumer Needs and Behavior, Aachen University, Germany.
Svobodova, K., P. Sklenicka & J. Vojar, 2014. Dominance level of significant features in post-mining landscapes as a predictor of perceived scenic beauty. In: Proceedings of the 22nd MPES Conference, Dresden, Germany, 14th – 19th October 2013. Mine Planning and Equipment Selection.
Torres Sibille, A. del C., V-A Coquell-Ballester, V-A Coquell-Ballester & R. Darton, 2009. Development and validation of a multi-criteria indicator for the assessment of objective aesthetic impact of wind farms. Renewable & Sustainable Energy Reviews, 13, 40 – 66.
Tsoutsos T., A. Tsouchlaraki, M. Tsiropoulos & M. Serpetsidakis, 2009. Visual impact evaluation of a wind park in a Greek island. Applied Energy, 86, 546 – 553.
Van den Berg, A.E. & C.A.J. Vlek, 1998. The influence of planned-change context on the evaluation of natural landscapes. Landscape & Urban Plg., 43:1-3, 1 – 10.
Van Haaren, R. & V. Fthenakis, 2011. GIS-based wind farm site selection using spatial multi-criteria analysis (SMCA). Evaluating the case for New York State. Renewable & Sustainable Energy Reviews. 15, 3332 – 3340.
Victorian Civil & Administrative Tribunal (VCAT), 1999: Hislop & Ors v Glenelg SC. Melbourne.
Victorian Coastal Council (VCC), 1998: Landscape Setting Types for the Victorian Coast, Tract Consultants and Chris Dance Land Design.
West, A., 2004. Debate between Ann West, Vice Chair of Country Guardians, and Alison Hill, Head of Communications, British Wind Energy Association, Ecologist, 34:3.
Wohlwill, J.F., 1978. What belongs where: research on the fittingness of man-made structures in natural settings. Landscape Research, 3:3, 3 – 5.
Wolsink, M., 2007. Planning of renewable schemes: Deliberative and fair decision-making on landscape issues instead of reproachful accusations of non-cooperation. Energy Policy, 35, 2692 – 2704.