
Land cover Click here
Forests Click here
The first part of this theme deals with general land cover of vegetation while the second part examines specifically forests. References are found here: References
Land cover
Land cover is the clothing of the land and refers to the vegetation on the surface of the land, including grass and pasture, crops, shrubs, trees and forests. Most of the studies, however, concentrate on trees and forests.
Studies of land cover by Dr ANDREW Lothian
The project, Amenity Value of Scattered and Isolated Trees (Lothian, 2004), assessed the visual amenity provided by scattered and isolated trees which commonly occur on farmland in South Australia. These are often large remnant gum trees including Red Gums (Eucalyptus camaldulensis) and form attractive pastoral landscapes.
 Large remnant scattered and isolated trees
The purpose of the project was to provide a basis for assessing the visual amenity created by these trees so that this could be considered in applications for their clearance by farmers. From a large number of photographs of trees, 112 were selected and rated by 440 people on a 10-point scale which provided the basis for the analysis.
Detailed analysis across the categories of nine tree characteristics (e.g. height, canopy form, species) and two context (terrain, land use) characteristics quantified the contribution of each to the ratings of scenes (Table 1). It found that preferences increased markedly with the greater number and density of trees, healthier trees, and height of trees (Figures 1 & 2). For the other characteristics, however, ratings did not change appreciably across them. There was some supporting evidence for a relationship between ecological health and landscape quality, but it was not definitive.
Table 1 Influence of tree characteristics on ratings (1 – 10 scale)
 Lothian, 2004

Figure 1 Influence of tree height on ratings (exaggerated scales)
 Lothian, 2004. 10-point scale.
Figure 2 Influence of health on ratings (exaggerated scales)
In the Flinders Ranges project (Lothian, 2009), the vegetation was scored according to its visual significance (Figure 3) and also by its lushness or aridity. Figure 4 which compares the vegetation scores with its lushness or aridity indicates that high aridity was linked to low vegetation significance and lushness (i.e. low aridity) was linked to high vegetation significance.

Figure 3 Rating of vegetation, Flinders Ranges

Figure 4 Relationship between vegetation and its lushness (1) -aridity (5)
 Score 2.18 Wilpena Pound, Flinders Ranges

Score 4.24 Mt Bayly Range, Flinders Ranges
Flinders Ranges scenes with lushness (1) – aridity (5) score
In the South Australian Generic Landscapes project (Lothian, 2013), ratings increased with the visual significance of the vegetation (Figure 5).
 Lothian, 2013.
Figure 5 Relationship between tree scores and ratings
In the project on the Lake District (Lothian, 2013), scenes without trees rated an average of 5.94 and with trees rated 6.11. Analysis indicated that there is an optimum density of trees which attract maximum ratings, but increasing the density beyond that decreased the ratings (Figure 6).
 Lothian, 2013
Figure 6 Influence of land cover density on ratings, Lake District
Figure 7 shows the influence of tree spacing on ratings. The highest ratings were for those between scattered and dense, and for scattered trees. Dense stands of trees rated slightly lower as do isolated trees. Thus from both analyses, it is evident that the preference is for scattered trees or moderate land cover rather than dense tree cover.
 Lothian, 2013
Figure 7 Influence of tree spacing on ratings, Lake District
 Lake District, Pooley Bridge, Tree spacing score 2, Scenic rating 3.74

Lake District, Derwentwater, Tree spacing score 5 Scenic rating 7.5
In the Mt Lofty Ranges study (Lothian 2015), land cover had a very positive influence on ratings, increasing from a rating of 2.85 for nil land cover to over 8 for the most visually significant land cover (Figure 8). The highest ratings were for tall dense trees (Figure 9).
 Figure 8 Mt Lofty Ranges – Ratings of all scenes vs land cover score

Figure 9 Mt Lofty Ranges – Ratings of dense trees
These studies have shown that the presence of trees increases ratings, that ratings increased with the number, health and height of trees, all of which affect their visual significance; that ratings peaked for a moderate density or spacing of trees but declined with greater density. Ratings were higher for lush vegetation than for arid vegetation.
Other studies of land cover
The ubiquity of trees in studies is striking – in a survey of the 227 studies (Lothian, 2000), 178 (78%) included trees. Trees are among the most familiar of content elements in landscapes, and their contribution to scenic quality is generally positive. Table 2 summarizes 58 studies of trees and vegetation.
Table 2 Studies of preferences for land cover (in chronological order)

Nearly half of the 58 studies covered subjects in the US (26), eight were in the UK, six were in Australia, four in Scandinavia and three in Spain. Among the interesting findings of these studies are the following.
Abello et al, (1986) found from their analysis of Spanish forests a higher preference for forests that exhibited “simultaneously greater fertility, some pattern or rhythm, and a certain structural legibility. The authors believed the findings supported a socio-ecological interpretation of landscape aesthetics as the dominant characteristics have a survival promoting properties.

In their study of the preferences of students in Western Australia and Michigan for WA jarrah forests, Kaplan, R. & Herbert (1987) found close agreement, despite the cultural differences (Figure 10). They found the highest preferences were for forests and areas not heavily wooded, which parallels the findings above about the density of woods. Arid woodlands were least preferred.

Kaplan, R. & Herbert, 1987
Figure 10 Preferences of Australian and American students for Western Australian jarrah forests
In an exploratory study of preferred tree forms, Sommer and Summit (1995) had subjects rate computer generated tree icons of varying canopy size, trunk size and trunk width. They found a preference for large canopies and for smaller and thinner trunks (Figure 11). Large canopies were related more to trunk thickness than trunk height.
 Sommer & Summit, 1995 Figure 11 Preferences for tree attributes
In examining the effect of naturalness on preferences, Purcell & Lamb (1998) used scenes of low forest and scrub that was intact or altered, dense or sparse (Figure 12). Overall, they found the preferences for low forest was 5.89 and for scrub, 5.33, nearly a 10% difference.
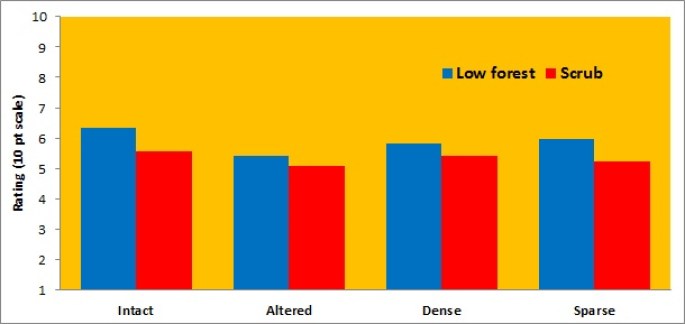 Purcell & Lamb, 1998 Figure 12 Preferences for low forest and scrub
 Tree at Castel, Israel
In Israel, Misgav (2000) assessed people’s preferences for different tree forms and Table 3 shows the most and least preferred categories. The most preferred were plant height and density and foliage color while the least preferred were plant form, spatial arrangement and exfoliation color and grain texture. In contrast with temperate regions where winter is characterized by barren trees and snow and is not preferred compared with the thick foliage of summer, in Israel, summer is characterized by an arid appearance in the vegetation and winter is preferred when there is ground cover, budding trees and wild flowers.
Table 3 Most and least preferred tree characteristics, Israel
 Misgav, 2000
To test Gobster’s (1999) assertion that ecological information would alter aesthetic preferences, Hill & Daniel (2007) provided information on the ecological benefits of either open/savanna-like conditions or of denser woodland conditions. If they had influence, there would be a preference for more open savanna and denser woodlands. The results, however, were contrary to this and found no support for the efficacy of ecological information as a means to alter landscape aesthetic preferences. They concluded: The data are more consistent instead with the notion that aesthetic preferences for natural (or naturalistic) landscapes are mediated by affective processes, perhaps developed by natural selection during human evolution, that are relatively independent of the influences of contemporary information interventions or rational arguments. However, a later study (van der Wal et al, 2014) found that when presented with new information about biodiversity & deer management that more than 50% changed their preferences in accordance with the new information and favored less dense understorey vegetation instead of dense understorey.
To test whether Kaplan’s informational criteria were influenced by seasonal changes in land cover, Kuper (2013) tested participants with photographs taken in early and late summer and fall. Participants estimated the presence of each criterion in the scene. The results indicated that only legibility was affected by seasonal factors, the other criteria were unaffected (Figure 13).
 Kuper, 2013 Figure 13 Effect of seasonal influence on Kaplan’s informational criteria
Land cover summary
- The presence of trees in a landscape is preferred to a scene without trees.
- After water, trees and vegetation are generally the next highest preference in the landscape, ahead of land forms.
- Many trees are preferred over few trees, but moderate density is preferred over high density – partial enclosure rather than full enclosure.
- Introduced conifers in the UK, Scandinavia, Australia, New Zealand and some other countries are viewed negatively, whereas in the US and Canada, where they are indigenous, they are viewed more positively.
- Generally broad-leaved deciduous trees are preferred over non-deciduous, although an exception is the Australian Eucalypts, which are non-deciduous.
- Trees in the foreground have a positive impact on scene preferences.
- Trees along rivers enhance a river’s scenic quality.
- Trees that are green and red are preferred over purple, orange-brown trees.
- Trees convey beneficial physiological and psychological effects.
- Trees are preferred that have large canopies and large trunks, together with shapes that are pyramid, fan or round. Most studies favor tall trees over small trees.
- Trees are preferred with order, balance, symmetry and a tidiness about them
- Trees are preferred that possess diversity and interest provided by mixed species, crooked trunks and age.
- Disliked are trees that lack boldness – scrawny, small, thin trees or those that have been changed artificially from a natural form by pruning.
FORESTS
Forests are an economically productive form of land cover and because foresters have conducted many of the surveys, the majority focused on how forest management can affect scenic quality. These are summarized below in chronological order.
- Cook (1972) evaluated walker’s preferences for hardwood forest trees and the extent by which these accorded with timber quality and found a good correlation. Favored characteristics included balanced form, straight trunk and thick crown; however, crooked trunks, leaning trees and even lopsidedness were also favored.
- Daniel & Boster (1976) developed their Scenic Beauty Estimation method in the ponderosa forests of Arizona. Daniel & Schroeder (1979) applied it to derive a model of scenic quality in a forest landscape, while Daniel et al (1978) used the SBE method to map the spatial scenic beauty of forest landscapes.
- Arthur (1977) related landscape quality with various forest management treatments and found that large trees, high contrasts and heavy canopies enhanced scenic quality while the amount of slash (i.e. piles of unmarketable wood) affected it adversely.
- Anderson (1978) aimed to develop a reliable approach for assessing visual forest resources and found foresters more amenable to scenes of clear cutting, poorly stocked areas and new growth of cutover stands than were residents or students.
- Gregory Buhyoff and his colleagues undertook a series of studies of the damage by the Southern Pine Beetle (Dendroctonus frontalis) on the scenic preferences of forest landscapes. These showed that preferences varied inversely with the proportion of visible forest damaged by beetles (Buhyoff & Leuschner, 1978) and that knowledge about beetle damage adversely affected preference ratings (Buhyoff et al, 1979; Buhyoff & Riesenman, 1979). A linearised logarithmic model was derived for preferences of informed subjects (Buhyoff et al, 1980). A separate model was derived for pines over 9 years old, which found that stand age, the diameter of trees and the stocking density of trees were all positively related to scenic quality (Buhyoff et al, 1986). The study also found that scenic quality was optimal for trees of around 1100 – 1200/acre after which scenic quality decreased and also that thin-stemmed trees were regarded negatively. Rosenberger & Smith (1998) reviewed various studies of the impact of forest insect damage on scenic beauty.
- Schroeder & Daniel (1981) extended Arthur’s (1977) study to develop a valid and useful model for predicting scenic beauty of forest landscapes by including a range of forest mensurations of overstorey, understorey, ground cover and downed wood. The relationship between SBE values and physical forest features provided the basis for the scenic beauty prediction model. The model, derived in Arizona, was applied to another forest in Colorado and performed reasonably well.
 Second Valley pine forest, South Australia
- Schroeder & Brown (1983) tested a range of mathematical forms of scenic beauty regression models and found the nonlinear forms (i.e. log & square root) performed only slightly better than the linear forms
- Vining et al, (1985) evaluated landowner perceptions of hardwood forest management. They found that the amount of dead and downed wood had a strong negative influence on preferences. Clear cut areas and heavily thinned areas were the lowest in scenic preferences while the lightly thinned stands were comparable with the natural stands.
- Hull & Buhyoff (1986) developed their Scenic Beauty Temporal Distribution method, based on the SBE method, to assess the effects of forest management over time (Figure 14). By including the stand age in their regression equation for scenic beauty, as well as tree density and size, they were able to predict the changes to scenic beauty with time. Decreasing stand density, less productive sites, and increasing stand age increased scenic beauty.
 Hull & Buhyoff, 1986. Scenic Beauty estimation (SBE) method used
Figure 14 Scenic beauty modeled over time for managed forests
- Ribe (1991) also modeled the effects of forest management on scenic beauty over time and found that uneven-aged management produces higher long-term scenic beauty than even-aged management. The highest scenic beauty occurs with naturally regenerated old-growth hardwood forests over 200 years old.
- Brown (1987) combined assessments of scenic beauty of pine plantations with management costs to identify efficient combinations for producing scenic beauty and the tradeoffs with timber, forage & water benefits.

Fire degrades scenic quality – Mt Lofty Ranges, South Australia
Rosenberger & Smith (1998) summarized the findings in relation to scenic quality from many studies of forest management:
- Fire damage immediately reduces scenic beauty and while prescribed burns can also affect scenic beauty, after a few years of recovery, it can be enhanced due to the removal of slash.
- Harvesting, especially clear-cutting, has the greatest effect on scenic beauty in the short term. In general, the more trees removed, the greater the scenic impact.
- Slashing has a high negative impact depending particularly on its height. Its impact can be reduced by burning, removal, lopping, chipping and spreading.
- Regeneration after harvest can restore scenic beauty but planted stands are preferred over natural regeneration. Thinning of natural regeneration can enhance scenic beauty and create open parklike stands.
Rosenberger & Smith (1998) found the following factors enhance scenic beauty:
- The presence of large dominant trees (>15” dbh).
- A mix of dominant and non-dominant species – e.g. pines with oaks, junipers, aspen, birch and firs.
- Older large trees enhance, dense small trees diminish scenic beauty.
- An open parklike stand is preferable to dense forest stands.
- While an understorey of seedlings and shrubs diminishes scenic beauty, it is enhanced by grasses and forbs which can help create an open parklike appearance.
Concerned about the image of forestry, in a paper provocatively titled What are we hiding behind the visual buffer strip? Hull et al, (2000) argued that the: The forestry profession needs an explicit and serious discussion about its policy on forest aesthetics. If, as we contend, forest aesthetics provide the public façade for forestry ethics, then forestry practices should not appear hypocritical to skeptical citizens. Forestry’s aesthetic policy should be socially acceptable, ecologically appropriate, easily comprehended, and economically feasible. Others, such as Lewis (2008), have worked with local communities to review alternative landscape management scenarios.
Clearcutting is a major political dividing issue in N-W United States. Ribe & Matteson (2002) surveyed 1035 people, dividing them into three equal sized groups: productionists, protectionists, and non-aligned. Their findings are shown in Figure 15.
 Ribe & Matteson, 2002. Figure 15 Response patterns to clearcutting propositions among respondent categories
They found:
- Very few people wanted unrestricted clearcutting;
- There was no consensus on outlawing clearcuts; protectionists favored a ban while productionists were opposed to prohibition;
- Replanting is regarded as essential by most but is not sufficient to justify clearcutting, according to the protectionists and also by many productionists;
- Foresters were not strongly trusted by respondents, even by productionists, but a substantial number of the non-aligned and productionists gave weak assent;
- There were even fewer who trusted wildlife managers, even among protectionists, although possibly they rejected the use of wildlife managers to facilitate clearcutting;
- Few agreed that clearcutting is allowable if it is not seen; they did not want to be “fooled” by hiding it. The real issue is not appearance.
In a subsequent study, Ribe (2006) found from 270 responses the following descending order of acceptability of forestry alternatives:
- light thinnings;
- harvests that retain 40% green trees;
- unmanaged mature and old-growth forests;
- heavy thinnings and unmanaged young forests;
- harvests that retain 15% green trees;
Overall, he found:
…broad, passionate opposition to clearcutting, conflict over the acceptability of not managing forests, conflict over old-growth harvests, conflict with some passionate opposition to 15% retention harvests, and unconflicted acceptance of young forest thinnings and 40% retention harvests. Modeling of these responses found that socially acceptable forestry attends to scenic beauty and serves wildlife needs, while also serving human needs but not at a high cost to these first two values.
Later, Ribe (2009) carried out a further study in which he examined the influence of basal area (area of tree trunks per hectare m2/ha), tree density (trees/ha), retention pattern (100% cleared i.e. clearcut, to 0% cleared), and down wood (high and low down wood levels). His study found: “Scenic beauty tended to be optimized at a basal area of 110–155 m2/ha and/or 700–900 trees/ha. Older forests and those with larger trees were perceived to be more beautiful. In harvests, greater retention levels, less down wood, and dispersed rather than aggregated retention patterns contributed to aesthetic improvements. Green-tree retention harvests offer considerable potential gains in perceived scenic beauty compared to perceived very ugly clearcuts, particularly at higher retention levels.”
In a wide-ranging study in the State of Washington, Kearney & Bradley (2011) surveyed foresters, urban and rural general public, recreationists, educators and environmentalists with an eight-page questionnaire asking their preferences for a range of forest treatments, attitudes toward forest management, self-assessed knowledge of forest management and demographic characteristics. The questionnaire included 31 color photographs of forest treatments with a 1 – 5 scale of preference. The study found:
- Stakeholder and demographic factors did not affect forest preference and there was a similarity of preferences among different groups;
- Foresters strongly believed in non-market values of forests (e.g. wildlife, fish, environmental quality, recreation, aesthetics) as well as for timber;
- Having a utilitarian perspective on forest management resulted in a preference for active forestry in scenes;
- Conversely, having an ecosystem/amenities perspective did not decrease preference for managed forests, nor did it increase preference for natural scenes; preference for natural scenes was uniformly high across all groups;
- Knowledge about timber management resulted in a stronger utilitarian perspective of forest management with the exception of environmentalists who did not support the utilitarian perspective.

Tasmanian native forest
In Tasmania, Australia, Ford et al (2006) asked various interests their views about clearfelling the native forests, and the results point to vast gaps between conservationists and the foresters (Table 4). For the conservationists and the non-affiliated, clearfelling is the least acceptable and selective logging is the most acceptable, however for foresters, the opposite applies. The authors believe that these responses derive from people’s deeply held social values.
Table 4 Views on clearfelling, Tasmania, Australia
 Ford et al, 2006. Table shows most agreed five issues out of 20. Mean acceptability judgement for harvest system 1-7 scale.
The contrasting positions of the groups is further shown in Figure 16 by those who view timber as a resource and therefore are happy with clearfelling the entire forest (0% retention) versus all other groups who do not hold this position.
 Ford et al, 2009
Figure 16 Acceptability of forest retention by different groups
From a later study involving modeling public acceptability judgements, Ford et al (2014) concluded: An important new finding that has emerged from exploration of the model is that aesthetic experience is informed by values, particularly use/intrinsic values for nature, and in turn informs beliefs about consequences for the natural environment.
In 2003, Willis et al reported on the social and economic benefits of forests in Great Britain and found that the value of the view of woodlands was £269 (US$370) per annum per household. In addition, were the values of recreational visits to forests, biodiversity and carbon sequestration benefits, and the health benefits from the absorption of air pollutants. The annualized benefits exceeded £1 billion (US$1.4 B) and the capitalized value (i.e. the total income expected to be gained over its economic life) was over £29 billion (US$41 B).
Forests summary
Forests are preferred with moderate density, not too dense but also with a spaciousness of openings and the ground cover being visible. People are definite about what they dislike in forests – images of slash, downed trees, thinning, and especially clearcutting which destroy the illusion of a natural forest and remind the observer that the forest they are viewing is managed for economic ends.