
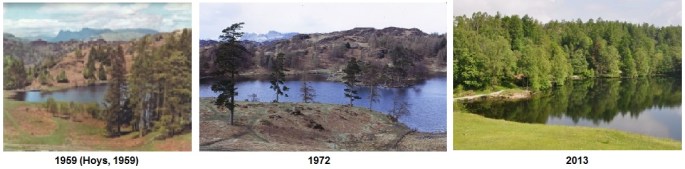
Figure 1 The changing appearance of Tarn Hows, Lake District, England, 1959 – 2013
HISTORICAL LANDSCAPE CHANGE
Landscapes are never constant but change over time, seasonally as well as over longer periods. This can be observed by comparing old photographs with the present (Figure 1). Change is the only constant. What we grew up with and remember from childhood is often changed beyond recognition when we return decades later due to developments, changes in land use, removal of features and other changes. New landscapes are constantly created.
The changes that occur in the use and development of land over generations have been of considerable interest to geographers. Their impacts on the landscape have also been examined.
The International Association for Landscape Ecology has a particular interest in changing landscapes and has held conferences in Europe and North America on this theme. Landscape ecology focuses on the causes and effects of landscape patterns and characteristics and their underlying ecological effects. Although centered on the ecological rather than aesthetic effects, the IALE conference held in Estonia in 1996 concluded that the intensification of agricultural land use, together with marginalization, was resulting in a loss of biodiversity and landscape diversity (Mander, 1998).
Some landscape ecologists have used the thermodynamic concept of entropy to measure the fragmentation of landscapes. Entropy was originally a measure of the chaos in a closed system – i.e. physical disorder, and then it became a measure of disorder in information. The visual diversity of a landscape or a city, frequently used in planning regulations, is a measure of entropy, high diversity being high entropy, monotony being low entropy. Fragmented landscapes have small spatial units and high entropy. Dominating landscape features or rare features will have low entropy and provide little information about the landscape as a whole.
Entropy is measured by the formula: H(A) = c ∑pi ld(pi) where:
H(A) is the entropy in bits for attribute A
pi is the probability of occurrence of category I of the attribute A
ld is the binary logarithm as the units are bits
c is a constant, usually -1.
Entropy can be determined using transects of maps or from field sampling. Landscape elements that can be mapped include vegetation (crops, grass, deciduous trees, hedgerows), land uses (orchards, nurseries, wasteland, industry, lakes) and linear structures (roads, railways, powerlines, river, canal).
Figure 2 illustrates the distribution of entropy over time for two areas in Belgium (Antrop, 1998). Destelbergen is an urban fringe area that was gradually absorbed by the city of Ghent and the figure reflects the change from low entropy up to 1960 giving way to higher entropy of 1995. In contrast, Verrebroek is an agricultural polderland which experiences little change, and its entropy is low and has unchanged over the decades.

Figure 2 Evolution of entropy for two areas in Belgium
In the early 1970s, Andrew Lothian carried out an early assessment of landscape change through mapping the extent of native vegetation in the Mount Lofty Ranges in South Australia covering the post-WW2 period (Figure 3). Overall there was a major reduction in the area of vegetation and considerable fragmentation of the extensive blocks of vegetation into smaller, more isolated areas of trees. The effect of this change on landscape quality is questionable. The change may actually have enhanced landscape quality through creating greater diversity and heterogeneity in the landscape and through creating areas of savannah woodlands.

Figure 3 Native vegetation change, Mt Lofty Ranges, South Australia, 1945 – 68
Figure 4 illustrates how changing land use though urban expansion affects landscape quality. The original rural landscape is changed over a decade into urbanscape. The initial years after the subdivision and building of houses the land was bare but after about five years, the trees that have been planted had grown sufficiently to soften the otherwise hard surfaces of the houses and roads. An open rural landscape gave way to a densely populated and built-over expanse of land.

Table 1 summarizes fourteen of the many studies of landscape change.
Table 1 Studies of landscape change (chronological order)


Figure 5 Changes in the landscape of central Spain
In Spain, Gómez-Limón & de Lucıo Fernánde (1999) examined the change from savannah woodland to denser woodland between 1930 and 1995 (Figure 5) and in Tasmania, Mendel & Kirkpatrick (1999) showed how scenes of mountains dominated in photographs of the island’s National Parks (Figure 6).

Figure 6 Changing frequencies of landscape elements in photos of Tasmanian National Parks
In southern Sweden, Skånes & Bunce (1997) traced the evolution of the landscape through key strategic periods since pre-historic times (Figure 7). This illustrates the changing nature of the landscape, particularly due to human-induced change. Vuorela et al, (2002) traced the extent of woodland in south west Finland from the 1600s (Figure 8).

Figure 7 Evolution of the Swedish agricultural landscape, 1500 BC – 1997 AD

Figure 8 Woodland coverage, Ruissalo Island, Finland, 1600s – 1990
In Japan, Ichikawa et al, 2006, traced the change in an area south-west of Tokyo from agricultural and woodlands to an urban landscape (Figure 9).

Figure 9 Changes in land use, near Tokyo, 1880 – 2001
Antrop (2005) modeled the increasing pace of change in the European landscape over the past century (Figure 10) with population growth, the rise of the cities and globalization, progressing from the pre-industrial age, through the revolutionary period to the current post-modern landscapes.

Table 2 Landscape change surveys (chronological order)

At Cape Cod in Massachusetts, US, Palmer (1997) compared ratings of scenes from 1976 and 1987 and found them very close (Figure 11) which indicates stability of aesthetic preferences over time.

Figure 11 Ratings of land use, 1976 and 1987, Cape Cod, Massachusetts
Several studies have examined short term change, what may be termed ephemeral change. Brassley (1998) argued for greater consideration of the weather, seasons, growth and decay of plants, the choice of farm crop, and so on. An example is the great storm of 16 October, 1987 in southern England and its effect on enhancing landscape amenity was the subject of a paper by Sellgren & Sellgren (1990). The storm blew over 15 million trees and damaged thousands.
Visualizations and scenarios of landscape change
Although photographs and computerized line diagrams have been available for decades (see Zube et al, 1987), it required the development of computer memory and power, digital photography and computer programs to manipulate photographs for visualizations of landscapes to attain realism. Eckart Lange (1994, 2000) provided examples of visualizations used in Switzerland. Lange & Bishop (2001) reported on the conference, Our Visual Conference, held in Ascona, Switzerland in 1999 which included reviews of visualization technology.
Table 3 summarizes seven studies have used these technologies to present visualizations and future scenarios of landscapes thus providing the basis for preference surveys.
Table 3 Landscape visualization and scenario surveys (chronological order)

In Switzerland, Hunziker et al, (2008) presented four scenarios of future landscapes to various groups and found a preference for the status quo with the traditional next preferred (Figure 12). Land use intensification or reforestation lowered landscape quality.

The images used by Lange (2001) in evaluating the degree of realism of three types of simulation are shown in Figure 13.

Summary of landscape change
Changes in landscapes over historical time have been an emerging field in landscape aesthetics. While most of the surveys have been in Europe, they were not accompanied with surveys of people’s preferences regarding the changes. Some studies have measured change in terms of entropy, a measure of disorder in which diverse and changing landscapes have high entropy and stable landscapes such as in rural areas have low entropy. Some of the studies, mainly in Europe, have covered centuries of landscape change. Commercial afforestation of formerly agricultural areas reduces visual diversity and hence scenic quality.
The loss of hedgerows and field boundary trees, farm ponds, wetlands and woodlands which has often accompanied intensification of agriculture and the aggregation of properties brought on by economic and structural factors has reduced scenic quality in many parts of the UK and Europe. The spread of urban areas over farmland has significantly affected scenic quality of these areas. Re-wilding of farmlands can result in dense brush and scrub and change attractive pastoral landscapes to vegetated landscapes which lack visual diversity. However, tree planting in recent years has enhanced landscape quality. Densifying formerly scattered urban settlements result in the loss of scenic quality.
Recent technological innovations in digital photography, computing and programming over the past decade have allowed visualizations and simulations of proposed changes and the evaluation of alternative options.
 Zermatt, Switzerland, 1890 (top LHS) to 2007 (bottom RHS). The Matterhorn may be same but the valley landscape has changed dramatically with the expansion of Zermatt. Also there are far more trees on the right hand slopes than in the early years when they were barren.
References
Antrop, M., 2005. Why landscapes of the past are important for the future. Landscape & Urban Plg., 70: 1-2, 21 – 34.
Aretano, R., I. Petrosillo, N. Zaccarelli, T, Semeraro & G. Zurlini, 2013. People perception of landscape change effects on ecosystem services on small Mediterranean islands: A combination of subjective and objective assessments. Landscape & Urban Plg., 112, 63 – 73.
Arnberger, A. & R. Eder, 2011. Exploring the Heterogeneity of rural landscape preferences: an image-based latent class approach. Landscape Research, 36:1, 19-40.
Bastian, O & M. Röder, 1998. Assessment of landscape change by land evaluation of past and present situation. Landscape & Urban Plg., 41, 171 – 182.
Bishop, I.D., R.B. Hull & C. Stock, 2005. Supporting personal world-views in an envisioning system. Env. Modelling & Software, 20:12, 1459–1468.
Brassley, P., 1998. On the unrecognized significance of the ephemeral landscape. Landscape Research, 23:2, 119 – 132.
wald, K.C. 2001. The neglect of aesthetics in landscape planning in Switzerland. Landscape & Urban Plg., 54, 255 – 266.
Fjellstad, F.J. & W.E. Dramstad, 1999. Patterns of change in two contrasting Norwegian agricultural landscapes. Landscape & Urban Plg., 45, 177 – 191.
Foran, B. & K. Wardle, 1995. Transitions in land use and the problems of planning: a case study from the mountainlands of NZ. Jnl. Env. Mgt., 43:2, 97 – 127.
Gómez-Limón, J. & J.V. de Lucıo Fernánde, 1999. Changes in use and landscape preferences on the agricultural-livestock landscapes of the central Iberian Peninsula (Madrid, Spain). Landscape & Urban Plg., 44:4, 165 – 175.
Hersperger, A.M. & M. Bürgi, 2010. How do policies shape landscapes? landscape change and its political driving forces in the Limmat Valley, Switzerland, 1930–2000. Landscape Research, 35:3, 259-279.
Hunziker, M., P. Felber, K. Gehring, M. Buchecker, N. Bauer & F. Kienast, 2008. Evaluation of landscape change by different social groups results of two empirical studies in Switzerland. Mountain Research & Development, 28:2, 140 – 147.
Ichikawa, K., N. Okubo, S. Okubo & K. Takeuchi, 2006. Transition of the Satoyama landscape in the urban fringe of the Tokyo metropolitan area from 1880 to 2001. Landscape & Urban Plg., 78:4, 398 – 410.
Kadlecova, V., W.E. Dramstad, E. Semancikova & K.R. Edwards, 2012. Landscape changes and their influence on the heterogeneity of landscape of the South Bohemian Region, the Czech Republic. Int. Jnl. Sustainable Dev. & World Ecology, 19:6, 546-556.
Lange, E. & I.D. Bishop, 2001. Our visual landscape: analysis, modeling, visualization and protection – conference on visualization. Landscape & Urban Plg., 54:1-4, 1 – 3.
Lange, E. & S Hehl-Lange, 2005. Combining a participatory planning approach with a virtual landscape model for the siting of wind turbines. Jnl. Env. Plg. & Mgt. 48:6, 833 – 852.
Lange, E. & S Hehl-Lange, 2010. Making visions visible for long-term landscape management. Futures, 42:7, 693 – 699.
Lange, E. & S Hehl-Lange, 2011. Citizen participation in the conservation and use of rural landscapes in Britain: The Alport Valley case study. Landscape Ecological Engineering, 7:2, 223 – 230.
Lange, E. & W.A. Schmid, 2000, Ecological planning with virtual landscapes: three examples from Switzerland. Landscape Research, 19:1-2, 156 – 165.
Lange, E., 1994. Integration of computerized visual simulation and visual assessment in environmental planning. Landscape & Urban Plg., 30:1-2, 99 – 112.
Lange, E., 2001. The limits of realism: perceptions of virtual landscapes. Landscape & Urban Plg., 54, 163 – 182.
Lewis, J.L., 2008. Perceptions of landscape change in a rural British Columbia community. Landscape & Urban Plg., 85, 49 – 59.
Lothian. J.A., 1972. Evidence presented to the House of Representatives Select Committee on Wildlife Conservation, 15 April, 1971.
Lothian, A. & C.R. Harris, 2014. Clearance of native vegetation in the Mount Lofty Ranges, 1945 – 68. Retrospective and update. South Australian Geographical Jnl, 113, 29 – 42.
Mander, Ü & R.H.G. Jongman, 1998. Human impact on rural landscapes in central and northern Europe. Landscape & Urban Plg., 41:3-4, 149 – 153.
Mason, C.F., K.L. Elliot & S. Clelland, 1987. Landscape changes in a parish in Essex, eastern England, since 1838. Landscape & Urban Plg., 14, 201-209.
Mendel, L.C. & J.B. Kirkpatrick, 1999. Assessing temporal changes in the reservation of the natural aesthetic resource using pictorial content analysis and a grid-based scoring system- the example of Tasmania, Australia. Landscape & Urban Plg., 43:4, 181 – 190.
O’Riordan, T., C. Wood & A. Shadrake, 1993. Landscapes for tomorrow. Jnl. Env. Plg. & Mgt., 36:2, 123 – 147.
Palang, H., U. Mander & A. Luud., 1998. Landscape diversity changes in Estonia. Landscape & Urban Plg., 41, 163 – 169.
Palmer, J.F., 1997. Stability of landscape perceptions in the face of landscape change. Landscape & Urban Plg., 37:1-2, 109 – 113.
Palmer, J.F., 2004. Using spatial metrics to predict scenic perception in a changing landscape. Landscape & Urban Plg., 69, 201 – 214.
Schneeberger, N., M. Bürgi & P.D. Felix Kienast, 2007. Rates of landscape change at the northern fringe of the Swiss Alps. Historical and recent tendencies. Landscape & Urban Plg., 80, 127 – 136.
Sellgren, J. & A., 1990. The great storm 1987: an assessment of its effects upon visual amenity and implications for the management of new growth. Landscape Research, 15:1, 20 -28.
Skånes, H.M. & R.G.H. Bunce, 1997. Directions of landscape change (1741-1993) in Virestad, Sweden – characterized by multivariate analysis. Landscape & Urban Plg., 38:1-2, 61 – 75.
Soliva, R., J. Bolliger & M. Hunziker, 2010. Differences in preferences towards potential future landscapes in the Swiss Alps. Landscape Research, 35:6, 671 – 696.
Stock, C., I.D. Bishop & R. Green, 2007. Exploring landscape changes using an envisioning system in rural community workshops. Landscape & Urban Plg.,79:3-4, 229 – 239.
Tahvanainen, L., M. Ihalainen, R. Hietala-Koivu, O. Kolehmainen, L. Tyrväinen, I. Nousiainen, & J. Helenius, 2002. Measures of the EU Agri-Environmental Protection Scheme (GAEPS) and their impacts on the visual acceptability of Finnish agricultural landscapes. Jnl. Env. Mgt. 66:3, 213-227.
Vuorela, N., P. Alho & R. Kalliola, 2002. Systematic assessment of maps as source information in landscape-change research. Landscape Research, 27:2, 141 – 166.
Wagner, M.M. & P.H. Gobster, 2007. Interpreting landscape change: Measured biophysical change and surrounding social context. Landscape & Urban Plg., 81, 67 – 80.
Zube, E.H., D.E. Simcox & C.S. Law, 1987. Perceptual landscape simulations: history and prospect. Landscape Jnl., 6:1, 62 – 80.
Zube, E.H., S. Friedman & D.E. Simcox, 1989. Landscape change: Perceptions and physical measures. Env. Mgt., 13:5, 639 – 644.