
Introduction
Visual diversity or variety in a scene is often regarded as a factor in influencing preferences and enhancing landscape quality. Diversity, like naturalness, is a derived quality of the scene. In contrast to the reductionist factors of land form, land use, land cover and water, it is a holistic quality which is the sum total of all its elements. As a function of all the elements in a scene, one approach to the measurement of diversity is to measure the contribution of each attribute. For example, land form can be regarded as forming a continuum from flat featureless plains of low diversity through hilly landscapes of medium diversity to rugged mountainous landscape with high diversity. However, the relationship between the level of diversity and the land form may not be linear as suggested here. Similarly, land cover ranges from a few trees through to many, a single species of vegetation ranging through to many species, a single height and form through to many heights and forms. Diversity of vegetation is clearly not simply a function of the number of trees; many other factors relating to the forms, heights, types, colors, textures, etc. of the trees are involved.
 Vineyards near Hahndorf, South Australia – visually diverse and interesting
Diversity cannot be measured by using a reductionist approach as there are many factors to be considered in each element, and they are very difficult to classify on a range. More fundamentally, equality between the elements cannot be assumed. Scoring of land form, land cover, etc. separately by whatever criteria and adding the results assumes equality in the importance in each of them in terms of their contribution to diversity. This assumption is not necessarily true. The results can be nonsensical, for example, a scene with a variety of land uses, trees on hilly terrain scoring high on each but the results not equating with one’s intuitive assessment of its overall diversity.
Diversity thus needs to be assessed by examination of the whole scene. While the attributes of land form, land cover, land use, water and color helped inform judgements, describing diversity in terms of the “busyness” of the scene – the presence of differing objects, textures, forms, colors, etc. assists in its evaluation. Scenes lacking in diversity are characterized by monotony – for example, extensive crops with few trees or land forms to relieve them. Pine plantations, another monoculture also lacks diversity – indeed the relationship, monoculture = monotony, expresses it well.
Studies of visual diversity by Dr Andrew Lothian
In the study of the South Australian landscape, diversity was scored on a 5-point scale by a group of participants, and the results are summarized in Figure 1 and Table 1. These indicate that the South Australian landscape is middle ranking in diversity with relatively few scenes of high diversity, which accords with knowledge of this landscape. The trend line indicates that for each unit of diversity (e.g. from 3 to 4), ratings increase by 1.34 which is a substantial amount.
 Lothian, 2000. Figure 1 Diversity of the South Australian landscape
Table 1 Scoring of Diversity
 Note: There were no score 5s in the South Australian landscape
 Aroona Valley, Flinders Ranges – high diversity in land forms, land cover and color Rating 7.20, Diversity score 4
The study of the South Australian coast (Lothian, 2005a) found diversity to have a strong influence on ratings – for each unit increase in the diversity score, ratings increased by 1.5 units (Figure 2), a very large increase. The River Murray study found diversity scores to be higher, up to 4.5, but its influence on ratings was not as strong, with ratings rising by 1 for each unit increase in diversity (Figure 3). For the Flinders Ranges, the influence of diversity was similar to that of the River Murray (Figure 4).
 Trend line: y = 1.50x + 2.17; r2 = 0.55. Figure 2 Diversity of the SA coastline
 Trend line: y = 0.99x + 3.18; r2 = 0.36. Figure 3 Diversity of the River Murray
 Trend line: y = 1.10x + 3.15; r2 = 0.66. Figure 4 Diversity of the Flinders Ranges
In the study of the Lake District (UK), diversity had the strongest influence of all components with ratings increasing by 1.45 for each unit increase in diversity (Figure 5). However there were no scores of 5 for the Lake District. Land form and land cover had the greatest influence on diversity as evident from Figures 6 and 7 which compare these components with diversity.
 Trend line: y = 1.45x + 2.16; r2 = 0.63. Figure 5 Diversity of the Lake District
 Trend line: y = 0.51x + 1.85; r2 = 0.27 Figure 6 Lake District – land cover & diversity
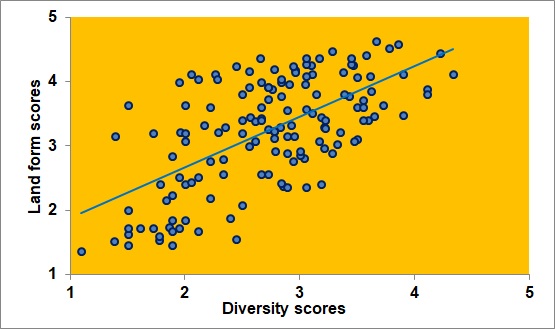 Trend line: y = 0.79x + 1.09; r2 = 0.40 Figure 7 Lake District – land form & diversity
The Mount Lofty Ranges survey found diversity to have a somewhat weaker influence than in the previous studies, increasing ratings by 0.84 for each unit increase in the diversity score (Figure 8). Interestingly the component that had the greatest influence on diversity was color increasing by 1 for each unit increase in the visual significance of color (Figure 9).
 Trend line y = 0.84x + 3.55, R² = 0.34 Figure 8 Mt Lofty Ranges: Diversity scores vs ratings
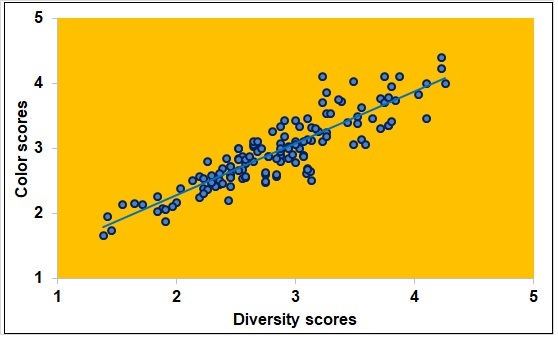 Trend line y = 1.00x – 0.10 R² = 0.79 Figure 9 Mt Lofty Ranges: Diversity scores vs color scores
These findings indicate that diversity, like naturalness, has a profound and positive influence on landscape quality ratings. In all but two of the six surveys, diversity increased ratings by more than one unit, up to 1.5 ratings in the case of the coast, and 1.45 in the Lake District.
Other studies of diversity
In the review of findings of landscape preference studies, none of the surveys covered diversity, although Brown & Itami (1982) identified spatial diversity as a component in the Kaplan’s complexity component in their information processing model.
Several studies have used complexity as an alternative to diversity. While clearly they are not identical – complexity denotes a level of difficulty in comprehension due to the sheer number of elements, their characteristics and their interrelationships, whereas diversity simply refers to the abundance of elements, nevertheless, complexity provides a useful alternative to diversity.
In an early study (Kaplan et al, 1972), participants rated scenes for both preference and complexity. They found a close relationship: nature scenes r = 0.69, urban scenes r = 0.78. Figure 10 indicates that for each unit increase in complexity, preferences increased by 0.71.
 Kaplan et al, 1972. Trend line: y = 0.71x + 1.76; r2 = 0.46
Figure 10 Complexity vs preference
The study also included urban scenes, but preferences for the nature scenes exceeded preferences for most urban scenes, clearly indicating a preference for nature over urban environments. However, the authors noted that complexity cannot account for this difference. Interestingly, Ribe (1986) found a correlation of 0.58 between diversity and preference for river scenes, which was similar to the above figure of 0.69.
Complexity comprised a component in the Kaplan’s information processing model of landscape aesthetics, which identified four predictor variables in which coherence and legibility help one understand the environment and the other two, complexity and mystery, encourage its exploration. These help humans make sense of the environment and be involved in it.
The Kaplan’s described complexity as a scene’s capacity to keep an individual busy, i.e. occupied without being bored or overstimulated. Often referred to as diversity, variety or richness, it was once regarded as the single most important factor. The Kaplans described it as how much is “going on” in the scene (which is similar to the author’s definition of diversity as the busyness of a scene) – a single field of corn stretching to the horizon will not have the same level of complexity as many fields of many crops on undulating land with hedgerows, trees and cottages. The more complex scene will tend to be preferred to the simple.
De la Fuente de Val et al, (2006) used participants to evaluate 11 visual attributes in photographs from Spain and Chile from which the qualities were identified and their preferences measured. The authors found complexity and diversity to be complementary attributes which they, along with other researchers, had found to be the most significant predictors of preference.
Based on an extensive literature review, Ode et al, (2008) proposed the description of experience-based complexity through the use of three dimensions that the various definitions have in common (Table 2).
Table 2 Dimensions of complexity

Ode et al, 2008
In examining the factors that constitute the dimensions of complexity perception, Ode et al, (2010) developed a framework (Figure 11) in which the complexity dimensions of variety and number interact with the dimensions of coherence – repetition and hierarchical grouping. The arrangement shows that the complexity elements may be counterbalanced by the coherence elements. The right hand graph illustrates the same approach with complexity from landscape patches and other linear features.
 Ode et al, 2010. Graph of how the complexity dimensions variety and hierarchical grouping interacts with repetition and number
Figure 11 Dimensions of complexity perception
The subject of complexity attracts complex explanations, none more-so than by Papadimitriou (2012) in a paper titled: The algorithmic complexity of landscapes. In this, he uses the notion of Kolmogorov complexity named after the gifted Soviet mathematician, Andrey Nikolayevich Kolmogorov, which refers to the amount of the computability resources needed to specify the object. Papadimitriou writes that the “K-complexity of a landscape is calculated from a string x of symbols representing the landscape’s features (e.g. land use), whereby each symbol belongs to an alphabet L, and can be defined as the size of the shortest string y that fully describes x.” This is useful as it provides a direct measure of complexity and can be applied to compare the complexity of several landscapes.
Visual diversity summary
Whether it is termed diversity, variety or complexity, the abundance of features in the landscape positively influence preferences. The author’s studies showed it to have, together with naturalness, the strongest influence of all attributes. Land form and land cover, in particular, contributed to diversity. Complexity is one of Kaplan’s predictor variables, contributing to the richness and intricacy of the scene and inviting immediate involvement.