
Naturalness denotes the extent to which the scene exhibits a natural appearance with the imprint of human presence not being readily apparent. Naturalness is a continuum, a relative concept, from pristine through to the totally artificial. There is probably no place on earth that has not been affected, however slightly by human presence on the planet, for example, by the presence of artificial chemicals in remote areas transported there by winds or litter on remote beaches transported there by ocean currents. However, naturalness here refers to the visually apparent degree of naturalness as evident in the scenes.
Naturalness is an holistic or derived factor based on the content of the scene, it does not actually exist as a physical feature such as trees, rocks and river, but rather is perceived from one’s judgement of the scene. It is the element underlying the specific attributes of water, trees and land forms examined separately.
 An attractive pastoral landscape where grazing has removed the ground cover – it may appear natural but is not
Perceived naturalness is not necessarily identical to ecological naturalness, as those with knowledge of the natural sciences may identify factors which suggest the area has been grazed or otherwise changed by human use. Pastures with scattered trees, the pastoral landscape, is often regarded as natural whereas it has derived from grazing the ground cover. Joan Nassauer (1995) believes that people see nature through cultural lens and the nature that Americans most prefer is more closely related to an 18th century concept of the picturesque and the beautiful than it is to the understanding of ecological function…
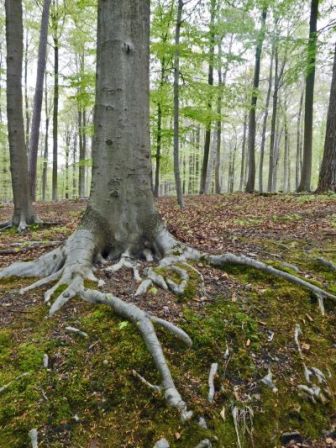
Tveit et al, (2006) has identified the following components of naturalness:
- Disturbance – a lack of contextual fit and coherence, where elements deviate from the context;
- Stewardship – reflects human care for the landscape through active and careful management;
- Coherence – reflects the unity of a scene, where coherence may be enhanced through repeating patterns of color and texture.
Following a detailed analysis of natural character in the New Zealand context, Low et al, (2010) defined it in the following terms:
Natural character occurs along a continuum. The natural character of a ‘site’ at any scale is the degree to which it:
- is part of nature, particularly indigenous nature;
- is free from the effects of human constructions and non-indigenous ‘biological artefacts’;
- exhibits fidelity to the geomorphology, hydrology, and biological structure, composition, and pattern of the reference conditions chosen;
- exhibits ecological and physical processes comparable with reference conditions.
Human perceptions and experiences of a ‘site’s’ natural character are a product of the ‘site’s’ biophysical attributes, each individual’s sensory acuity, and a wide variety of personal and cultural filters.
Stephen & Rachel Kaplan’s The Experience of Nature: a psychological perspective (1989) focused on the preference for natural settings and reviewed a range of relevant studies. In their conclusion, the Kaplans wrote: “Viewed as an essential bond between humans and other living things, the natural environment has no substitutes.”
Studies of naturalness by Dr Andrew Lothian
In Lothian (2000), naturalness was scored on a 1 – 5 scale and high naturalness was reflected in high ratings (Figure 1).
 Naturalness score 2
 Naturalness score 4.65
 Lothian, 2000. Figure 1 Naturalness of South Australia
The Coastal Viewscapes study (Lothian, 2005a) covered South Australia’s natural coastline, and this was reflected in the naturalness scores which were largely between 3 and 5 (Figure 2). The trend line indicated that for each unit increase in the naturalness score (e.g. from 3 to 4), ratings also increased by one unit.
 Lothian, 2005a. Figure 2 Naturalness of SA coast
The Barossa Valley is a largely agricultural area with relatively few natural areas, and this was reflected in the low scoring of naturalness (Figure 3).
 Lothian, 2005b Figure 3 Naturalness of the Barossa Valley
In contrast, the River Murray, Lakes and Coorong are much more natural in appearance as reflected in the high scoring of naturalness (Figure 4).
 Lothian, 2007 Figure 4 Naturalness of the River Murray
Similarly, the Flinders Ranges is highly natural with most scores above 3 (Figure 5).
 Lothian, 2009 Figure 5 Naturalness of the Flinders Ranges
The Lake District in England is a mixed farming area amidst splendid lakes, woods, fells and mountains and its naturalness is middle ranking (Figure 6).
 Lothian, 2013 Figure 6 Naturalness of the Lake District
In the Mount Lofty Ranges study, the influence on naturalness of land form and land cover were examined and it was found that land cover had a far stronger influence than land form (Figures 7 and 8). Although the R² are low, the trend line slope of 0.98 for land cover is more than three times steeper that of land form, 0.30.
 Lothian 2015 Figure 7 Mt Lofty Ranges: naturalness vs land form
 Lothian 2015 Figure 8 Mt Lofty Ranges: naturalness vs land cover
Other studies of naturalness
Table 1 summarizes 46 studies that examined the influence of naturalness on landscape quality preferences.
Table 1 Studies of the influence of naturalness on preferences (chronological order)

 The Rockies, Glacier National Park
Jones et al, (1976) surveyed road users of their enjoyment of views from a road through the Rockies in the State of Washington. Prominent among the positive features were natural scenes, while negative scenes included artificial features but also natural features such as wetlands and scrubland (Table 2). This suggests that it is not simply naturalness per se which influences preferences, but also the content of the scene. It is notable, however, that the ratings given to these negative natural scenes were generally less than for the artificial scenes, suggesting that the feelings against them were not as strong as against, for example, billboards, industry and the like.
Table 2 Features Viewed from Road in Rockies
 Jones et al, 1976
Civco (1979) assessed the natural, rural and urban landscapes of eastern Connecticut by asking respondents to rate the 32 landscape features contained in landscape photographs, features such as lakes, various types of trees, hills, shore-lines, wetlands, roads, fences, houses. Figure 9 indicates that the natural landscape elements were rated among the highest while the artificial elements were rated low.
 Civco, 1979 Figure 9 Ratings of Landscape Features
 Sandy coast, Vancouver Island, Canada
Dearden (1980) measured 30 landscape elements per 1 km grid square on Vancouver Island and used respondents to rate the scenic quality of these grid squares. Using regression analysis, the weights of each landscape element were derived. The ‘R’ scores are shown in Figure 10 and their size indicates the correlation between visual quality and the landscape element with the figure indicating whether it is a positive or negative relationship. Many of the positive features are natural elements of the landscape, the top 8 being: undeveloped coast, oak woods, rocky coastline, sandy coast, pine woods, relative relief, scattered trees and mudflats. Interestingly natural lakes and rivers were ranked lower than some artificial elements and the reasons for this are unknown.
 Dearden, 1980. Note: The ‘R’ value is shown here instead of the R2 to retain the positive or negative relationship.
Figure 10 Regression “R” Values – Landscape Elements Vancouver Island
Herzog (1987) assessed preferences for natural environments of mountains, canyons and deserts through the framework of Kaplan’s predictor variables: spaciousness, texture, coherence, complexity, mystery, and identifiability. He concluded that preference for deserts is enhanced by familiarity, diversity and mystery, mountains are well-liked elements of the landscape, and spacious canyons are preferred over narrow shadowy ones.
 Tall trees, Australian Alps
Lamb & Purcell (1990) examined naturalness in relation to Australian vegetation. They asked respondents to rate 71 slides for naturalness using a horizontal line 130 mm long with the words “not at all natural” at one end and “completely natural” at the other. No units were shown on the scale. Respondents rated slides against this scale. Results ranged from 53 to 115. While related to ecological naturalness, perceived naturalness was not equivalent. They found that tall and dense woods and forests were seen as more natural than low, open vegetation (Figure 11).
 Lamb & Purcell, 1990. Note: Part scale shown only.
Figure 11 Interaction of foliage density and naturalness, Australian vegetation
Scrub and heaths were seen as less natural than forests while heavily weed-infested forests were regarded as natural. Interestingly the effects of grazing were not regarded as natural but the resulting open, park-like ordered landscapes were, even though they are scarcely natural. Fire in the Australian context was regarded as a natural intervention. Overall, the authors concluded that “expected vegetation structure is the main criterion of naturalness and that viewers may discriminate quite finely in terms of unexpected species, life-forms, etc. particularly in low-growing vegetation.”
In a later study, Purcell & Lamb (1998) found that the rating of altered low forest was 14.5% lower than for intact low forest, and for scrub the figure was nearly 9% lower, thus indicating a preference for vegetation in a natural state.
In Nigeria, Choker & Mene (1992) surveyed preferences of urban, rural and natural landscapes. The means for these were: urban 8.4, rural 8.8, and natural 7.5 which is lower than the other two. However, while scenes of urban and rural areas received more extreme ratings, those of natural areas were less varied. Interestingly the least preferred natural scene was of tropical rain forest. In this developing nation, there was a preference for developed, economically significant urban and rural scenes. Among all the groups, natural landscapes were the least preferred (Table 3).
Table 3 Mean preference scores by respondent groups, Nigeria

Choker& Mene, 1992
The authors asked respondents what attributes determined their rankings of the scenes; the natural or physical attributes identified were, in order, the presence of greenery/shade trees, well-kept flowers, natural waterfront/river sides, well-trimmed grasses; others included recreational setting, perceived fresh, breezy atmosphere and general maintenance. The list is noteworthy for the number of interventions into the natural landscape. While the Nigerians liked trees, their preference was for trees of food or commercial value such as palm trees, coconut trees, papaw plants and citrus trees. Similarly, the rural uneducated respondents preferred natural scenes suitable for fishing, farming, hunting or forestry.
In the New Forest in England, Gregory & Davis (1993) assessed the aesthetics of riverscapes and found that the preference in natural woodland channels was for relatively deep clean water and banks that were being actively eroded. The most preferred scenes were not the most natural, for example, the presence of coarse woody debris was seen as undesirable but is, in fact, more natural.
In a Dutch study, de Groot & van den Born (2003) asked villages about their perception of naturalness. The villager’s description of landscapes fell into four types:
- 1. Landscape made by and for people;
- 2. Park-like, Arcadian landscape;
- 3. Wild, interactive landscape;
- 4. Landscape “in which one may experience the greatness and forces of nature.”
Interestingly, a majority (52%) preferred this last landscape which the authors termed “deep ecology”, while a further 32% preferred the wild, interactive nature. The majority of villagers regarded wild nature as more natural than Arcadian nature.
In contrast, when Fairweather & Swaffield (2003) asked New Zealanders about their preferences, 67% preferred “cultured nature” to “pure nature.” However, this was from a relatively isolated rural community with a high (42%) Mäori population and may not be representative of all New Zealanders.
In another Dutch study, van den Berg & Koole (2006) found the preference for wild nature to be 9% higher than for managed nature; of the six landscape pairs, wild nature was preferred in five, the exception being a forested area. Similarly, in his study of preferences for six terrestrial biomes (i.e. deserts, grassland, coniferous, deciduous and tropical forests, tundra), Han (2007) found that regardless of the biome, people “respond most to a natural setting possessing a high level of complexity and a large quantity of water features.”
In describing nine indicators that could be used in measuring landscape visual character, Ode et al (2008) included naturalness for which they identified the following indicators:

As a test for naturalness, Ode et al (2009) used three visual indicators:

They concluded that the study supported two of the indicators – succession and patches but not the varied edge indicator.
In her study of Australians trekking up to Mt Everest, Beza (2010) found that both Australians and their Sherpas placed snow-covered mountains, glaciers, ice falls, moraines, vegetation, signature architecture and a pristine landscape as the most beautiful, attributes which are mostly natural.
Naturalness summary
The studies described support the view that nature exerts a powerful influence on human landscape preferences. In most of its manifestations, whether as coast and sea, rivers and lakes, mountains and hills, trees and forest, the natural element nearly always produces positive preferences. There are, however, some natural scenes that tend to be regarded negatively and these include deserts, marshlands and scrubland. Erosion or vegetation debris in streams, though elements of the natural environment, also tend to depress preferences.
Where the presence of humans is apparent, such as through clear felling, grazing, pollution of water, dams and structures, the preferences are affected adversely. While there are some parallels between perceived naturalness and ecological naturalness, scenes which are artificially created or manipulated scenes may be perceived as natural.
This suggests that human preference for natural scenes is superficial, that it is concerned with the appearance, not the substance of the scene. Environments that are essentially artificial can be made to appear natural. Such an approach is, of course, well-known among theme park designers; the Disneyland creations of contrived nature. Nevertheless, some studies have also indicated that human observers are able to discriminate quite finely between natural scenes and those that have human influence.
The ecological-evolutionary viewpoint argues that naturalness preferences are survival-enhancing and that humans are able to discriminate between scenes that contribute to survival and those that may be adverse.