
Water has a major influence on landscape preferences and there have been many studies which quantify this influence.
Studies of water by Dr Andrew Lothian
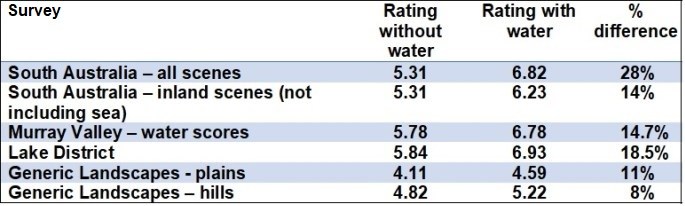
The influence of water on landscape preferences was investigated in five of the author’s surveys. Table 1 compares the ratings of all scenes with and without water. Leaving aside the findings from the Generic Landscapes study (as these were of agricultural land), the average increase in ratings from all surveys was 20.3%, a substantial increase.
Table 1 Comparison of ratings of all scenes, without and with water
 Lothian, 2000, 2007, 2013a & 2013b
The first survey of South Australian landscapes (Lothian, 2000) included water in coastal scenes with the sea visible, scenes of the River Murray, Lakes and Coorong, dams, desert mound springs, creeks, and the Blue Lake. That survey found that scenes of hills with dams of water averaged 6.06 while for scenes without dams, they averaged 5.21, a 16% difference.

A finding across several surveys is that just a glimpse of water is sufficient to raise ratings:
- 7.04 for a glimpse of water to 8.07 for maximum extent of water (Lothian, 2000).
- River Murray (Lothian, 2007). Figure 1 indicates that some scenes with minimal water rated as high as or higher than scenes with maximum water score. Based on the trend line equation, a water score of 1 rated 5.61 which is only 1.3 units lower than for a water score of 5 (Table 2). Thus it is not so much the extent of water as its presence that is important.
- In the Lake District, water has a positive influence on ratings (Figure 2) and that just a glimpse of water is sufficient to raise ratings (Figure 3).
Table 2 Derivation of ratings from water scores
 Note: Derived from y = 0.33x + 5.28
 Figure 1 Influence of water on ratings, River Murray
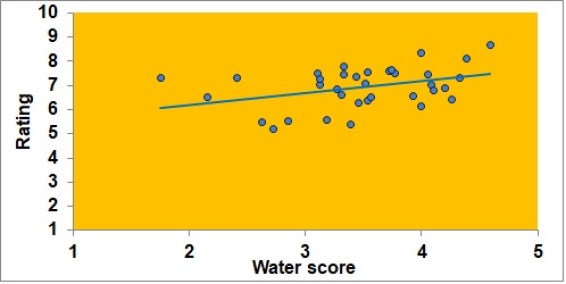 Figure 2 Relationship between ratings and water component, Lake District
 Figure 3 Influence of water area on ratings of valleys with lakes, Lake District
The presence of just a glimpse of water can thus have an appreciable influence on landscape ratings.
Another influence is the extent of the water/land edge:
- Rating of coastal water edge increased from 6.57 to 7.95; 15.5% increase over 4 classes (Lothian, 2000);
- Rating of River Murray edge increased from 5.62 to 6.95; 20.9% increase over 4 classes (Lothian, 2007).
The length of the physical land/water edge thus has a marked influence on landscape ratings.
The effect of water color on preferences was examined in three surveys:
- Lothian, 2000: All scenes, Blue water 6.28, tan water 6.16; 2% difference
Water in dams, blue water 6.20, tan water 6.16; 0.65% difference - River Murray (Lothian, 2007): Blue water 6.31, other colors (mainly tan) 6.33; 0.3% difference;
- Mt Lofty Ranges Water in dams, blue water 6.34, tan water 6.02; 5.3% difference
In three cases, blue water was preferred over tan colored water, but in the River Murray, other colors were preferred. The difference in preferences in all three cases was, however, slight. Of interest though is the high rating (7.95) of the Blue Lake in South Australia, a well-known regional attraction which turns blue during summer each year.
 Wikipedia. The blue color is due to chemical reactions. Blue Lake, South Australia
The Coastal Viewscapes survey (Lothian, 2005a) found that wave action in the scenes had a positive influence on landscape ratings. Figure 4 illustrates the ratings for the score of wave action from 1 to slightly over 4 with ratings increasing from 6.25 for score 1 to 7.96 for score 5, an increase of 27.2% over five grades.
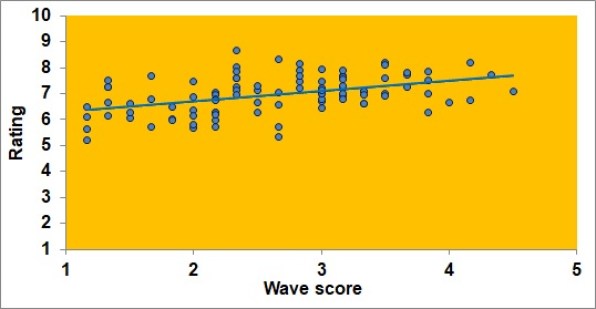 Figure 4 Wave scores vs ratings, South Australia
 Waves score 4.17 on a 1 – 5 scale
Cape Finniss, Eyre Peninsula, South Australia
Another influence on the ratings was reflections off the water. In the Murray Valley survey, reflections were rated: none, fair, and good. The mean for scenes without reflections was 6.08, for fair reflections was 6.69 (10% better) and for good reflections was 7.09 which was 16.6% better than scenes without reflections.
 River Murray – good reflections Rating 7.50
 River Murray – fair reflections Rating 7.08
These studies provide an indication of the significance that water plays in influencing landscape quality.
Other studies of water
Table 3 summarizes 51 studies that have touched on or examined the effect of water on landscape preferences.
Table 3 Studies of water (chronological order)
 Some of the studies are examined in more detail.
In his analysis of landscape photographs used in the development of a regression equation, Shafer et al, (1969) found through factor analysis that water features had among the highest factor loadings of any of the variables in a 26 X 26 correlation matrix. The area of the water features – stream, waterfall and lake, yielded slightly higher loadings than the perimeter of these features. Shafer’s regression equation contained ten terms and the water area featured in three of these, thereby indicating the importance of water in the landscape.
Calvin et al, (1972) used the semantic differential technique and factor analysis to analyze responses to photographs of landscapes, including several that incorporated water. Figure 5 summarizes the attribute scores of each scene for the natural scenic beauty factor and indicates that those with water were among the highest positively scoring scenes, although algae in streams was regarded negatively.
 Calvin et al, 1972; Note: Factor scores signs reversed to correspond with positive & negative perception of scenes. Factor scores shown are for Factor 1 – natural scenic beauty factor
Figure 5 Scores for landscape scenes
Palmer (1978) reported the results of an extensive landscape research project in Connecticut River valley led by Ervin Zube. The study identified 22 landscape dimensions, including water/land edge density per unit area and percentage water area per unit area. About 50% of the variation in scenic resource value was explained by seven dimensions. Scenic value was found to increase with naturalism (regression coeff = 0.59), landform variation (0.58), water/land edges (0.42) and the length of views (0.33). Findings related to specific land uses included:
- Farm landscapes – water area density had a major negative influence, suggesting that farm views dominated by large areas of water were not as scenic as those with smaller areas or water accents.
- Open water landscapes – scenic value increased with water/land edge and decreased as the proportion of water surface area increased. An elevated viewer position, increased difference between elevations within the view, and increased naturalism contributed to scenic quality.
- Wetlands and streams landscapes – scenic value increased with naturalness. In contrast to most surveys, it was found that diversity in land use and contrast in naturalism decreased scenic quality.
Ulrich’s (1981) survey found that while attentiveness declined regardless of the environment viewed, “the drop was significantly less when the scenes contained water,” water having “greater attention-holding properties.” He also found that whereas scenes of urban areas increased feelings of sadness, that water had a stabilizing effect on emotions and in particular, sharply reduced feelings of fear.
A definitive survey of water preferences was undertaken by Herzog (1985). Using factor analysis of preference ratings, he identified four waterscape types: mountain waterscapes; swampy areas; rivers, lakes and ponds; and large bodies of water. Based on S. Kaplan’s theories of information processing, the study used as predictor variables: spaciousness, texture, coherence, complexity, mystery, and identifiability with preference used as a criterion variable (Figure 6). Table 16 summarizes the mean ratings obtained for each predictor variable showing how they varied across each type of waterscape. These indicate that:
- Mountain waterscapes were distinguished by low textures;
- Swampy areas were distinguished by low spaciousness;
- Rivers, lakes & ponds were distinguished by high identifiability;
- Large water bodies were distinguished by spaciousness, texture and coherence but were low in complexity and mystery.
 Herzog, 1985 Figure 6 Rating of waterscapes by variables
Table 4 Correlation of variables with preference

Herzog found that only spaciousness and coherence were significant predictors of preference (Table 4). Regression analysis of the variables against the criterion variable of preference indicated that waterscapes high in spaciousness, coherence, and mystery, but low in texture (i.e. featuring coarse or uneven ground surface), were preferred to waterscapes with the opposite characteristics. The six predictor variables accounted for 71% of preference variance in mountain waterscapes, and for 74% in swampy waterscapes.

Large bodies of water are characterized by spaciousness – The Coorong, South Australia
In terms of content, mountain lakes and rushing water are the people’s choice, whereas swampy areas are unlikely ever to attract an enthusiastic following. In terms of predictor variables, the most preferred waterscapes were high in spaciousness, coherence and mystery but low in texture. Large water bodies and mountain waterscapes, both high in spaciousness were the most preferred while swampy areas are lowest in this variable and in preference.
Gobster & Chenoweth (1989) derived factor loadings on four factors for river landscapes, forest landscapes and agricultural landscapes. The four factors identified were:
Factor 1 artistic descriptor: complexity, uniqueness, topography, calmness of water, awe, arousal;
Factor 2 affective-informational: land use variety, degree of alteration, unity, balance;
Factor 3 spatial structure: distance, river width, land use variety, enclosure, mystery;
Factor 4: river sinuosity.
The Factor 1 descriptors together accounted for 61% of the variance, and all four factors accounted for 90%.
In contrast to other researchers who used photographs, Brown & Daniel (1991) used 12-second video clips to capture the dynamic nature of stream flow not apparent in still photographs (Figure 7). Scenic beauty maximized at 1285 cubic feet per second (cfs) (= 36.4 cubic metres per second) at Fort Collins and 1092 cfs (30.9 cumecs) at Tucson. Scenic beauty ratings were similar for low flows at 100 cfs (2.8 cumecs) as for high flows at 2000 cfs (56.6 cumecs). The findings indicated that flow quantity influences riparian scenic beauty up to a point and then decreases at higher flows. This finding was consistent across a wide range of vegetation, topographic and scene compositions.
 Brown & Daniel, 1991
Figure 7 Influence of river flow on scenic beauty
Hetherington, Daniel & Brown (1993) repeated the experiment but this time using sound as well, and comparing it with video without sound as well as with photographs and no sound. While the video with sound provided a polynomial similar to the previous study, the video without sound and the photos without sound provided a more linear function (Figure 8). Preferences peaked between 715 and 2300 cfs (20 – 65 cumecs) – a much wider spread than that found in the Brown & Daniel study.
 Hetherington, Daniel & Brown, 1993
Figure 8 Influence of video & sound on scenic beauty
 Brownhill Creek in flood, Adelaide, Australia
 pinterest.com View along the Blue Ridge Parkway
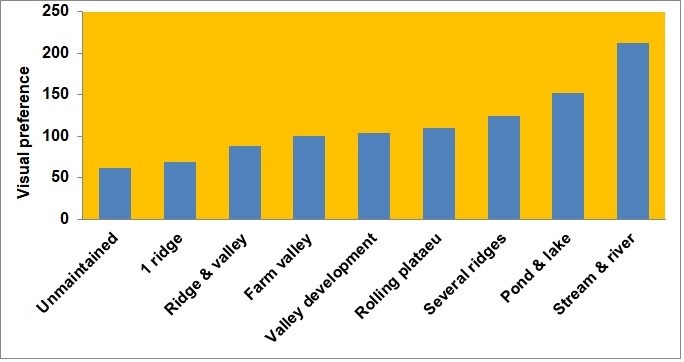
In a study of the iconic Blue Ridge Parkway in the southern Appalachians, Hammitt et al, (1994) which has views stretching out over ridges upon ridges, the highest visual preferences surprisingly were for water bodies – ponds, lakes, streams and rivers (Figure 9).
 Hammit et al, 1994
Figure 9 Visual preferences Blue Ridge Parkway, Southern Appalachians
 New Zealand river
Pflüger et al, (2010) found in a New Zealand survey that preferences increased as flow approached the mean and then declined with higher flows. Preferences were strongest when flows were ~60% of the average. Pflüger et al believed that aesthetic quality–flow relationships will generally form these concave patterns. They noted that recreational value versus river flows followed a similar pattern. They explained the concave relationship by the following observations by respondents:
- Low aesthetic quality at low flows corresponds to exposed banks and channel areas;
- Low aesthetic quality at very high flows corresponds to turbidity and the presence of suspended debris;
- Changes in water color can over-ride water quantity as a determinate of aesthetic value, if the color changes are distinct.
Schroeder (1991) analyzed the meaning that the Morton Arboretum in Chicago had for its many visitors. The Arboretum includes many water features – lake, pond, stream and river. These, together with the forest and colors were the most frequently mentioned features. Serenity was a word used to describe places with water. He wrote, the ability of trees, other vegetation, and bodies of water to function as ‘natural tranquilizers’ may be one of the most significant human benefits of preserving nature… This corresponds with its restorative function (see theme: Health and restorative benefits).
 mortonarb.org Morton Arboretum, Chicago
In their study of the Nigerian city of Warri, Choker & Mene (1992) found that, in natural scenes, the most preferred landscape was a natural river or water scenery with a surrounding natural and well-preserved tropical rainforest vegetation. The presence of water and a river was, after trees and flowers, the most important determinant of landscape quality, although dirty water or waterlogged conditions were regarded negatively. The importance of nature for fishing, farming, hunting and other economic needs was the reason given for the appeal of natural landscapes rather than concern for nature.
Herzog & Bosley (1992) included a wider range of scenes to evaluate the role of tranquillity on preference. Predictor variables used were mystery, coherence, spaciousness and focus, with tranquillity and preference the criterion variables. The preference means for the different landscapes are summarized in Table 5 and indicate that in terms of both tranquillity and preference, water ranks highest among the landscapes evaluated.
Table 5 Comparison of mean scores for tranquillity and preference (5 pt scores)
 Herzog & Bosley, 1992
Correlations between the descriptor variables and preference for the landscapes evaluated indicated high correlations for coherence and, to a lesser degree, focus (Figure 10). Mystery and spaciousness were negatively correlated for rushing water. Not surprisingly, the authors found that the turbulence in rushing water decreases the sense of tranquillity. While turbulence can focus one’s attention thereby aiding preference, it also conveys a lack of calmness that decreases tranquillity.
 Herzog & Bosley, 1992 Figure 10 Correlations of preference and variables
Gregory and Davis (1993) identified 22 factors that affected the scenic quality of riverscapes, some positively and some negatively. Scenic attractiveness was increased by the proportion of trees in the photograph, the number of tree trunks and the depth of water. Conversely, water color, channelization of the bank, percentage riverbank, the sinuosity of the channel, and amount of litter decreased scenic quality. Their regression equation for the scenic preferences of riverscapes indicated that nearly 90% of the average scenic preference variation could be defined by the water color, the stability of the channel banks and the average depth of water.
Using tape recorders and visitor photography, Hull & Stewart (1995) surveyed trail users on the views they encountered. Feeling states were recorded by participants en route and were classified thus: beauty, satisfied, relaxed, and excited. Figure 11 summarizes the average rating of these and indicates that the water bodies contributed most in terms of beauty and were also rated high for satisfaction and relaxation. However, the water bodies ranked among the lowest for excitement – which probably reflects the placid types of lake and river encountered.
 Hull & Stewart, 1995 Figure 11 Feeling states along trails

Wilson et al, (1995) reported in Hamilton, Canada, that respondents found that the ratings of water were affected by rubbish, aquatic vegetation, surface foam, a sign of health warning, and a distant industrial backdrop.
Nasar & Lin (2003) asked people about their feelings when they viewed color photographs of different sorts of fountains which used water in various ways – jet, still, flowing, falling or a combination of these. Figure 12 summarizes their findings for the effect they had on the viewers. Their highest preferences were for jets of water or the combination of water features. Still water had the greatest calming effect, much greater than any other water feature, and all types of moving water features had the capacity to excite people.
 Nasar & Lin, 2003 Figure 12 Rating of water feature
Nasar & Li (2004) researched the effect of water reflection on preferences. Using models of small ponds, two with water and two with glass with reflected views (i.e. across the water surface) or transparent views (i.e. to the pond bottom) they asked 60 participants to rate the attractiveness of each. They found, not surprisingly, that participants preferred water to glass, and they also found reflective views more attractive than transparent views (Figure 13).
 Nasar & Li, 2004 Figure 13 Preferences for reflections from water
Studies by Coss (1990, 2003) examined the preference for water by children by observing infants and toddlers (up to 24 months) mouthing and licking of stainless steel plates with mirrored surfaces which connote wetness. They found a preference for the shiny plates compared with dull surface plates, leading the researchers to conclude that the results suggest that infants and toddlers have the precocious ability to recognize the optical cues for water as characterized by the gleaming highlights and clear reflections of polished metal.
Tunstall et al, (2004) gave cameras to 150 children age 9 – 11 in London and took them to two rivers to take photographs and to record what they thought about them. Over 500 photos were taken. The children focused more on the river environment rather than the rivers themselves which accounted for only 16% of the photos and comments. This may be because the rivers were regarded somewhat negatively, being littered and polluted, with 52% making critical comments and only 29% were positive. Some showed an aesthetic appreciation of the broader river landscape and wide open spaces in choosing to represent ‘views’ of the rivers or flood-plain meadows. They particularly appreciated the trees and plants near the river, partly because they offered opportunities for play. Parts of the river were seen to be dangerous because of steep slippery banks, and the children wanted cleaner, safer, more accessible rivers and varied, adventurous and manipulable play opportunities. Figure 14 summarizes their evaluation of the rivers.
 Tunstall et al, 2004 Figure 14 Evaluation of two London rivers by children
In a Croatian study of student and expert interaction with several rivers, Stober et al, (2012) found that while 50% of the students visited the rivers frequently, daily or at least several times a week, only 20% of the Croatian students visited them this frequently. The frequency of visitation would be likely, the authors asserted, to “affect the formation of attitudes about the image of the river, which is part of shaping the attitude towards the observed landscape.”
 Wetlands, River Murray, Australia
Dobbie & Green (2013) examined people’s perceptions and attitudes towards wetlands in Victoria, Australia. Using 70 photographs of wetlands and interviews, they identified six categories differentiated by the amount of water visible, presence of trees, water quality and habitat value. They used a new term, “percipients” – the participants in their study who perceived the wetlands. Overall, the percipients perceived the wetlands “firstly as natural (eco)systems, providing habitat for wildlife, especially birds, and concurrently as places of beauty, to be enjoyed in passive or active recreational activities.”
White et al (2014) found that scenes photographed in overcast or rainy conditions had lower preference ratings than where they were photographed in sunny conditions. They found that waterscapes were particularly affected, with preferences being 12% lower for waterscapes compared with 9.8% for rural scenes and 5.2% for urban scenes (Figure 15).
 White et al, 2014 Figure 15 Effect of weather conditions on preference ratings
White et al, (2014) also found that waterscapes offered far greater preferences and restorativeness than either rural or urban environments (Figure 16). This suggests that the restorativenesss water provides may be an important factor in its attractiveness, but it does not explain why this might be so.
 White et al, 2014 Figure 16 Perceived restorativeness by landscape type
As well as rating water scenes for their visual quality, Bulut et al, (2010) asked respondents to assess them in terms of their vividness, harmony, fascination, naturalness and being interesting. The following summarizes their correlations with the best scene in each category:
- Waterfall (large): Fascination 0.71, interesting 0.66, vividness 0.55, harmony 0.51, naturalness 0.27.
- Lake (in rugged mountains): Vivid 0.64, interesting 0.59, fascination 0.57, harmony 0.51, naturalness 0.40.
- Mountain lake (with snow): Fascination 0.66, interesting 0.54, vivid 0.52, harmony 0.45, naturalness 0.42.
- Landslide lake (placid lake): Vivid 0.70, fascination 0.63, interesting 0.54, harmony 0.48, naturalness 0.39.
- River (in a gorge): Fascination 0.49, vivid 0.48, interesting 0.31, naturalness 0.24, harmony 0.20
These suggest that water engenders fascination, vividness and interest ahead of the qualities of harmony and naturalness.
Water summary
It is evident from the range of studies that water has a profound effect on landscape preferences. The studies reported that scenic value increased with the:
- Presence of water: Calvin et al, 1972, Zube, 1973, Jones et al, 1976; Palmer & Zube, 1976; Kaplan, R., 1977; Civco, 1979; Knopp et al, 1979; Dearden, 1980; Cherem & Driver, 1983; Zube et al, 1983; Vining et al, 1984; Herzog, 1985; Mosley, 1989, DeLucio & Mugica, 1994, Hammitt et al, 1994; Hull & Stewart, 1995; Tunstall, et al, 2004; Bulut & Yilmaz, 2009; Bulut et al, 2010; Lothian, 2000, 2005, 2013; Dobbie, 2013;
- Visual significance of water in the landscape: Orland, 1988; Lothian, 2000, 2005, 2006, 2013;
- Water edge: Anderson et al, 1976; Palmer, 1978; Whitmore et al, 1995; Lothian, 2000, 2006, 2013a, 2013b;
- Water area: Shafer et al¸ 1969, Carls, 1974; Anderson et al, 1976; Brush & Shafer, 1975; Yamashita, 2002; Lothian, 2000, 2006; Dobbie & Green, 2013;
- Channel stability & depth: Gregory & Davis, 1993;
- Moving water: Craik, 1972; Dearinger, 1979; Hammitt et al, 1994; Whitmore et al, 1995; Gobster & Chenoweth, 1989; Brown & Daniel, 1991, Hetherington, Daniel & Brown, 1993, Whitmore et al, 1995; Nasar & Lin, 2003; Bulut & Yilmaz, 2009; Bulut et al, 2010; Pflüger, et al, 2010;
- Wave action: Lothian, 2005;
- Water reflections: Lothian, 2006; Nasar & Li, 2004;
- Cleanliness of water and environs: Craik, 1972; Pitt, 1976; Nieman, 1978; Knopp et al, 1979; Yamashita, 2002
- Color: Lothian, 2000, 2005, 2006; Pflüger, et al, 2010;
- Naturalness: Calvin et al, 1972; Kaplan, R., 1977; Palmer, 1978; Hodgson & Thayer, 1980; Pomeroy et al, 1983; Whitmore et al, 1995;
Water thus contributes substantially to landscape quality, far beyond its area or visual significance in the landscape would suggest. Why water has such a powerful influence is discussed in the theme: Water, the secret ingredient.